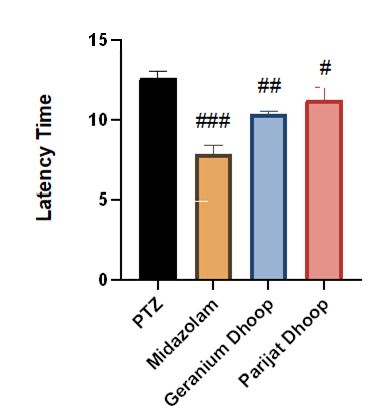
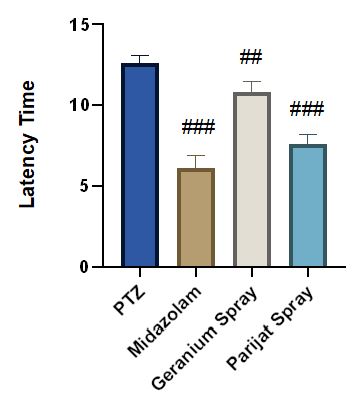
Figure 1: Effect of geranium and Parijat dhoop on the PTZ induced seizure model in rat
The values represented in the form of mean± SD; N=6; # (p<0.05), ## (p<0.01), ### (p<0.001) significantly different compared to PTZ group. Comparison between the groups was made by Oneway analysis of variance (ANOVA) followed by Dunnet multiple comparison.
Tables at a glance
Figures at a glance