Population Pharmacokinetics and Monte Carlo Simulation for Dosage Optimization of Vancomycin in the Treatment of Osteoarticular Infections in Patients
Received Date: November 23, 2025 Accepted Date: December 04, 2025 Published Date: December 06, 2025
doi:10.17303/jpdm.2025.8.105
Citation: JingYan Jin, Yu Li1, XiaoLin Li, Shouhua Mu, YinLian Tong, Wenbin Li, et al. (2025) Population Pharmacokinetics and Monte Carlo Simulation for Dosage Optimization of Vancomycin in the Treatment of Osteoarticular Infections in Patients. J Pharmacol Drug Metab 8: 1-12
Abstract
Background: Vancomycin is gaining interest in the treatment of complex osteoarticular infections (OA).
Objective: To conduct a population pharmacokinetic analysis of vancomycin in a prospective cohort of adult patients with Gram-positive OA infections to carry out Monte Carlo simulations for dosage optimization in the treatment of these infections.
Methods: Patients underwent blood sampling on day 5 of therapy (1-2 serial samples). Non-linear mixed-effects modelling was performed with Phoenix. Monte Carlo simulations were performed with eight vancomycin regimens (0.5g q6h; 0.5g q8h; 0.5g q12h; 0.5g q24h; 1g q6h; 1g q8h; 1g q12h and 1g q24h) to define the probability of target attainment (PTA) 400<AUC0-24h/MIC<600.
Results: forty patients provided 69 plasma concentrations. A single-compartment model and first-order elimination was developed. Estimated glomerular filtration rate (GFR) was included as covariate in the final model. Pharmacokinetic vancomycin estimates were 3.12L/h for CL and 20.41L for V. Monte Carlo simulations showed that for patients with osteoarthritic infections in the GFR range of 100~150, a daily dose of 2 g was recommended, which could be divided into 1g q12h or 0.5g q6h, while in the range of 80~100, 0.5g q8h was recommended, and lastly, in the ranges of 40~50 and 60-70, a daily dose of 1 g was recommended, which could be divided into 1 g q24h or 0.5 g q12h.
Keywords: Vancomycin; Osteoarticular infections; Population pharmacokinetics; Monte Carlo simulation
Introduction
As a wide inflammation resulting from microbial invasions of bone and/or joint structures, osteoarticular infections (OA) including osteomyelitis, orthopedic implant-related infections and septic arthritis are among the most difficult-to-treat infectious diseases [1, 2]. Gram-positive microorganisms are the most common causative pathogens of these infections, with Staphyloccocus aureus and coagulase-negative staphylococci being the most frequent ones, followed by streptococci, and Enterococci [1, 2].
Vancomycin is usually the preferred antibiotics for treating OA infections caused by methicillin-resistant staphylococci [3, 4]. However, the poor penetration of vancomycin into bone tissue, the occurrence of resistant strains of staphylococci and enterococci, and the presence of biofilm bacteria prevent optimal exposure at the site of infection, which in turn produces clinical treatment failure [5]. The key to bacterial clearance in patients with OA lies mainly in the appropriate concentration of antibiotics at the site of infection; too low a concentration can lead to antibiotic resistance and too high a concentration can lead to toxic reactions, and because of the narrow therapeutic window of vancomycin itself, how to achieve individualized dosing of vancomycin in patients with OA has become a long-standing concern in the clinic [6].
Population pharmacokinetics allows for quantitative or at least semi-quantitative guidance on individualized drug dosing and improves the safety and efficacy of medication [7]. The aim of this study was to conduct a population pharmacokinetic analysis among patients receiving vancomycin as therapy for OA infections, and to perform Monte Carlo simulations for identifying dosing regimens that may ensure effective concentrations of vancomycin for long- term treatment.
Methods
Study Design
This 1-year mono-center prospective clinical study was carried out between October 2022 and October 2023 among patients with OA who were admitted at the Ninety-fourth Hospital of the United Logistics Force, Lanzhou City, Gansu Province, and China. The study was approved by the ethics committee of our hospital (registration number: 2023KYLL165). Each patient signed an informed consent form prior to the study.
According to the study protocol, all patients were treated with vancomycin intravenously at a daily dose of 2g. Blood samples for measuring vancomycin concentrations were collected 30 min before and 1h after the 5th dose administration. The blood samples were centrifuged at 4000 rpm for 15 min at 4°C, and the plasma was stored at −80°C until analysis. The concentration of vancomycin in plasma was measured by high performance liquid chromatography.
Population Pharmacokinetic Analysis
Based on the concentration of vancomycin, population pharmacokinetic analyses were conducted by nonlinear mixed-effects modeling using the Phoenix NLME software (version 8.3.5, Certara Inc., USA). The first-order conditional estimationextended least squares (FOCE—ELS) method was employed for model development.
The mode of administration of vancomycin in this study is intravenous drip, and there is no absorption process in the body, so the zero-level absorption model is chosen. And the sampling mainly takes peak and trough sampling (sparse data), so the simpler one-room chamber disposition model was chosen to fit the base model. The inter-individual variability was estimated using the exponential model (Eq1), the residual variability was evaluated using additive (Eq2), proportional (Eq3), and mixed models (Eq4). The most appropriate statistical model was selected based on the following evaluation criteria: (a) a low value of the objective function (OFV); (b) good agreement in the Goodness-of-fit plot; (c) low standard error values on estimated pharmacokinetic parameters; and (d) a low estimate of between-subject.
where Pi represents the individual pharmacokinetic parameter value of the ith subject; P0 and η are the typical values of the parameter in the population and the inter-individual variability parameters (assumed to follow a normal distribution) respectively. Cobsij and Cpredij are the jth observation for the ith individual and the jth prediction for the ith individual, and εn is the intra-individual variability parameter (assumed to follow a normal distribution).
Covariates Analysis
Before screening covariates, we utilize graphical methods to check the correlation between covariates to avoid covariance and instability in parameter estimates. In addition, we can plot scatter plots of correlations between covariates and individual parameters, thus pre-screening potential covariates and avoiding unnecessary analytical calculations and statistical tests. Finally, covariates were screened by forward inclusion and backward exclusion. In the forward selection step, if the objective function value (OFV) decreases more than 3.841, it means that the covariate has a significant effect on the model (p<0.05, df = 1) and should be retained in the model, and the above process is repeated to find all covariates that have a significant effect on the model, and then the full regression model is built. Previously added covariates will be removed from the full regression model one by one. If the OFV increases more than 6.635, the covariate is highly significant (p<0.005, df = 1) and should be retained in the model; conversely, it should be removed from the model. Based on these results, the effect of each covariate on pharmacokinetic behavior was assessed.
Model Evaluation
The accuracy, stability, and predictability of the final population model were assessed by goodness-of-fit plots and by a non-parametric bootstrap - and predicted-corrected visual predictive check (pc-VPC).
Goodness-of-fit plots were used to assess the appropriateness of the final model. It included the plots of observed values against individual or population predictions and conditional weighted residuals (CWRES) against time or population predictions.
The stability of the final model was estimated using non-parametric bootstrap. A random sample of 1000 data sets generated was fitted, and the median of the parameters, as well as 95% confidence intervals, were calculated and compared with the parameter estimates of the final model.
The predictability of the final model was estimated using a predicted-corrected visual predictive check. The pc-VPC was used to simulate 1000 data sets to compare the distribution characteristics of the median and 95th percentile of the observed and simulated data at each time point.
Monte Carlo Simulation
The dosages were 0.5g and 1.0g, and the dosing intervals were 6, 8, 12, and 24 hours, which were ranked and combined to form eight dosing regimens, and we grouped them using the significant covariates retained by the final model, and each dosing regimen was subjected to 1,000 Monte Carlo simulations, and the number of individuals with an AUC/MIC (MIC=1mg/L) within the range of 400-600 was screened out based on the results of the simulations, and the PTA of each regimen was calculated. The PTA of each dosing regimen was then calculated, and the one with the highest PTA was selected as the best initial dosing regimen for this group of patients.
Results
Study Population
A total of 40 patients were enrolled whose demographic and clinical characteristics are summarized in Table 1. Median (minimum-maximum range) age, weight and GFR were 50.34(15 - 77) years, 65.05 (21-96) kg and 106.19 (45.52-149.99) mL/min, respectively.
Population Pharmacokinetics Modeling
The pharmacokinetics of the vancomycin was best described using a zero-level absorption, one-level elimination model. The exponential model best described the inter-individual variability in the pharmacokinetic parameters, and the residual variability was best explained by the additive error model.
After the base modeling was completed, we performed a preliminary screening of covariates. The results of the examination of the correlation between the covariates are shown in Figure 1 below, from which we can find that there is a high correlation between ALB and ESR, IL-6, AGE and GFR, WT and BMI, CrCL and GFR, Scr, WBC and NEU, and a certain degree of correlation between ALT and AST, and due to the presence of covariance between these covariates, we finally selected WT, ALB, ESR, AGE, GFR, CrCL, GFR, Scr, WBC and ALT as covariates to be included in the subsequent screening process. The results of the correlation analysis between base model clearance and covariates are shown in Figure 2, from which ALB, GFR, CrCL, ESR, Scr, BUN, CRP, Cysc, and HCT correlate with clearance, and the remaining covariates not listed do not.
During the first round of forward incorporation, ALB, CrCL, BUN, CYSC, GFR, SCr, ESR, CRP, and HCT all had a significant effect on vancomycin clearance, but GFR caused the greatest decrease in OFV values, so GFR was chosen to be included in CL as the new reference model. In the second round of forward incorporation process, we used the OFV value of model 14 as the reference value and found that all the covariates added did not make a significant change in the OFV value, therefore, GFR was finally selected as a significant covariate for vancomycin clearance, and no covariate had a significant effect on vancomycin apparent volume of distribution. The specific Stepwise examination procedure is shown in Table 2.
The estimated pharmacokinetic parameters of the final model and the comparison results with the base model are shown in Table 3. The final model could be described using the following equations:
Model Evaluation
The goodness-of-fit plots for the final models indicated that both the population prediction (PRED) and individual prediction (IPRED) showed good visual agreement with observed concentrations (Figure 3). The diagnostic plots showed that PRED versus observed concentrations were evenly distributed around the line of y = x, and less scatter points farther away from the Y = X line. After introducing the covariate, IPRED was more concentrated on Y=X, indicating that the covariate model can better fit the observed values. As shown in Figure 3, the distribution of the conditional weighted residuals (CWRES) of the final models was mostly between -2 and 2 and was evenly distributed above and below the coordinate Y = 0. The model diagnostic plots show that the final model developed fits the data well, and the selected error model was adequate.
The median values obtained from the bootstrap analysis were close to the final parameters estimated, and the final model parameter estimates were within the 95% confidence intervals of bootstrap results, illustrating the stability of the final model. The results are shown in Table 3. The VPC for the final model is presented in Figure 4. The results of model VPC showed that most of the 10%, 50%, and 90% percentile lines of the observed value were within the 90% confidence interval of the predicted value. This indicated that the final model predictions were reliable.
Monte Carlo Simulation
According to the actual GFR of patients with osteoarthritic infections, they were divided into nine groups: 40-50, 60-70, 80-90, 90-100, 100-110, 110-120, 120-130, 130-140 and 140-150. The PTA of the recommended dosing regimen for each group is shown in Table 4. As can be seen from Table 4, for patients with osteoarticular infections with GFR in the range of 100-150, the recommended daily dose is 2g, which can be categorized as either 1g q12h or 0.5g q6h, whereas if it is in the range of 80-100, it is recommended to be 0.5g q8h, and lastly, in the ranges of 40-50 as well as 60-70, the recommended daily dose is 1g, which can be categorized as either 1g q24h or 0.5g q12h.
Discussion
In this study, we successfully established the population pharmacokinetics of vancomycin in patients with osteoarthritic infections and recommended the optimal initial dosing regimen for each glomerular filtration rate segment based on Monte Carlo simulations.
In choosing the basic model of the atrial compartment model, we found that there are currently one-compartment, two-compartment, and three-compartment models describing the pharmacokinetic process of vancomycin in vivo, with the three-compartment model being mostly suitable for describing the cerebrospinal fluid compartment [8, 9]. It has been shown that the pharmacokinetic process of vancomycin during intravenous infusion is more consistent with the two-compartment model, but it is generally applicable to intensive sampling where the sampling time covers the absorption of the drug as well as the entire process of disposal. It has also been shown that simpler models provide utility to clinical [10]. Since only the peak and trough concentrations of each patient were collected in this study, which was sparse sampling and could not completely cover the absorption and disposal process of vancomycin in vivo, a one-compartment model was finally used to fit the data, and the parameter estimates were found to have high precision and good fit. Moreover, the one-compartment model has been used to characterize the vancomycin data at different ages and in different pathological states.
In this study, we examined the effects of gender, age, body weight, liver and kidney function, blood counts, and indicators of infection on vancomycin CL and V. Ultimately, GFR was found to be a significant covariate affecting vancomycin CL. Since vancomycin is mainly excreted via the kidneys, many studies have used CrCL as a significant covariate affecting vancomycin CL; however, there are a few studies that did not use it as a significant covariate, but instead modeled it using other variables that represent renal function, such as glomerular filtration rate, serum creatinine, continuous renal replacement therapy, and hemodialysis (11-14). Weight is frequently a significant covariate affecting vancomycin V. Body weight was not screened in this study, probably because the differences between the weights of the included patients were small enough to influence the final model.
The group typical estimates of CL and V in the final model were 3.12L/h and 20.41L, respectively.Studies have reported a range of estimates of vancomycin CL values from 0.334 to 8.75L/h, with a median of 3.22L/h, whereas a wider range of estimates of V values was reported, with the lowest estimate in the single-compartment model of 7.12L for patients with normal renal function. In contrast, for elderly patients, the highest estimated V value was 154L (15). The estimates of CL and V in this study are within the range reported in the literature, indicating that they are consistent with the actual clinical population.
The current clinical use of vancomycin is mainly based on the instruction manual to determine the initial dose. The instruction manual for vancomycin for injection (Stablex) specifies a maximum daily dose of 2 g of vancomycin, which can be divided into 1 g every 12 h or 500 mg every 6 h. The recommended daily dose for patients with osteoarthritic infections in the present study was 1 g to 2 g. We found that in order to achieve an AUC/MIC in the range of 400 to 600, the recommended dose required tends to increase. Since vancomycin is primarily excreted by the kidneys after intravenous administration, the clearance of vancomycin from the body may be accelerated in the presence of an elevated glomerular filtration rate, requiring an increase in the dose to achieve the target range. On the contrary, if the patient's glomerular filtration rate is low, we need to reduce the dose in order to avoid the accumulation of the drug in the body to trigger a toxic reaction.
The limitations of this study are as follows: (1) this is a single-center prospective study, considering the different methods of detecting vancomycin levels in different hospitals and the differences between different races, so the applicability of the model may be poor; (2) the issue of co-administration has not been taken into account; (3) the recommended dosing regimen has not been validated in the clinic, so it is necessary to analyze and evaluate the applicability of the recommended dosing regimen in conjunction with the effectiveness and safety data of the clinical application in a later stage. Therefore, it is necessary to analyze and evaluate the applicability of the recommended dosing regimen with the effectiveness and safety data after clinical application.
Conflicts of Interest
The Authors declare no Conflicts of Interest.
Funding
The study was supported by the National Natural Science Foundation of China (No. 82173738).
Data-Sharing Statement
The data will not be made available to other investigators.
- Tande AJ, Patel R. 2014. Prosthetic joint infection. Clin Microbiol Rev 27: 302-45.
- Saeed K, Esposito S, Ascione T, Bassetti M, Bonnet E, Carnelutti A, et al. (2019) International Society of Antimicrobial Chemotherapy B, Skin, Soft Tissue Infections Working G. Hot topics on vertebral osteomyelitis from the International Society of Antimicrobial Chemotherapy. Int J Antimicrob Agents 54: 125-33.
- Osmon DR, Berbari EF, Berendt AR, et al. (2013) Diagnosis and Management of Prosthetic Joint Infection: Clinical Practice Guidelines by the Infectious Diseases Society of America [J]. Clinical Infectious Diseases. 56: 1-25.
- Ariza J, Cobo J, Baraia-Etxaburu J, et al. (2017) Executive summary of management of prosthetic joint infections. Clinical practice guidelines by the Spanish Society of Infectious Diseases and Clinical Microbiology (SEIMC) [J]. Enfermedades Infecciosas y Microbiología Clínica. 35: 189-95.
- Rio-No L, Sorli L, Arderiu-Formenti A, et al. (2023) Therapeutic Drug Monitoring of Vancomycin Concentrations for the Management of Bone and Joint Infections: An Urgent Need [J]. Tropical Medicine and Infectious Disease. 8: 113.
- Koch B, Zhao Q, Oosterhoff M, et al. (2022) the mysteries of target site concentrations of antibiotics in bone and joint infections: what is known? A narrative review [J]. Expert Opin Drug Metab Toxicol. 18: 587-600.
- Liu L, Wang J, Zhang H, et al. (2022) Model-Informed Precision Dosing of Antibiotics in Osteoarticular Infections [J]. Infect Drug Resist. 15: 99-110.
- Li X, Sun S, Ling X, et al. (2017) Plasma and cerebrospinal fluid population pharmacokinetics of vancomycin in postoperative neurosurgical patients after combined intravenous and intraventricular administration [J]. European Journal of Clinical Pharmacology. 73: 1599-607.
- Li X, Wu Y, Sun S, et al. (2016) Population Pharmacokinetics of Vancomycin in Postoperative Neurosurgical Patients and the Application in Dosing Recommendation. Journal of Pharmaceutical Sciences. 105: 3425-31.
- Adane ED, Herald M, Koura F (2015) Pharmacokinetics of Vancomycin in Extremely Obese Patients with Suspected or Confirmed Staphylococcus aureus Infections. Pharmacotherapy. 35: 127-39.
- Liu TT, Pang HM, Jing L, et al. (2019) A population pharmacokinetic model of vancomycin for dose individualization based on serum cystatin C as a marker of renal function. J Pharm Pharmacol. 71: 945-55.
- Mangin O, Urien S, Mainardi J, et al. (2014) Vancomycin Pharmacokinetic and Pharmacodynamic Models for Critically Ill Patients with Post-Sternotomy Mediastinitis. Clinical Pharmacokinetics. 53: 849-61.
- Chung J, Jin S, Yoon J, et al. (2013) Serum Cystatin C Is a Major Predictor of Vancomycin Clearance in a Population Pharmacokinetic Analysis of Patients with Normal Serum Creatinine Concentrations. Journal of Korean Medical Science. 28: 48-78.
- Bae S H, Yim D S, Lee H, et al. (2019) Application of Pharmacometrics in Pharmacotherapy: Open-Source Software for Vancomycin Therapeutic Drug Management. Pharmaceutics. 11: 1134-67.
- Aljutayli A, Marsot A, Nekka F (2020) An Update on Population Pharmacokinetic Analyses of Vancomycin, Part I: In Adults. Clin Pharmacokinet. 59: 671-98.
FIGURE 1
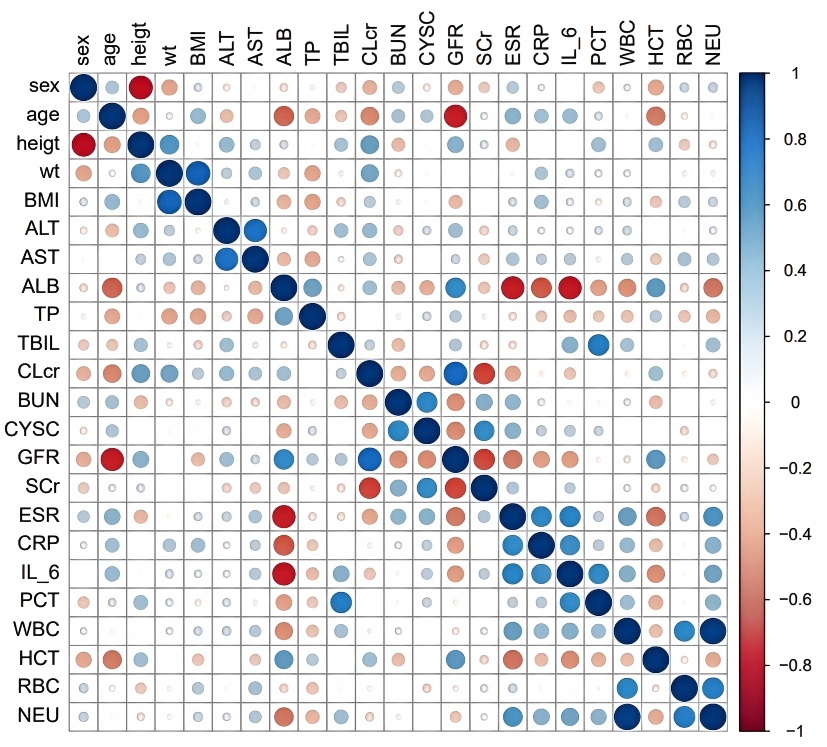
Figure 1: Correlation Analysis of Covariates
FIGURE 2
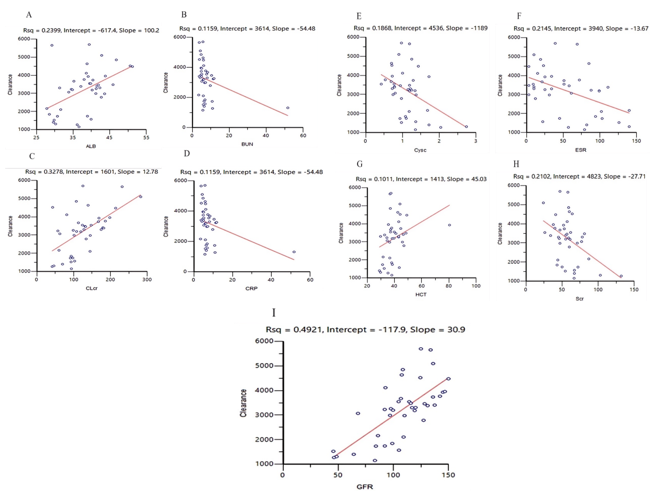
Figure 2: Correlation Analysis between Base Model Clearance and Covariates
FIGURE 3
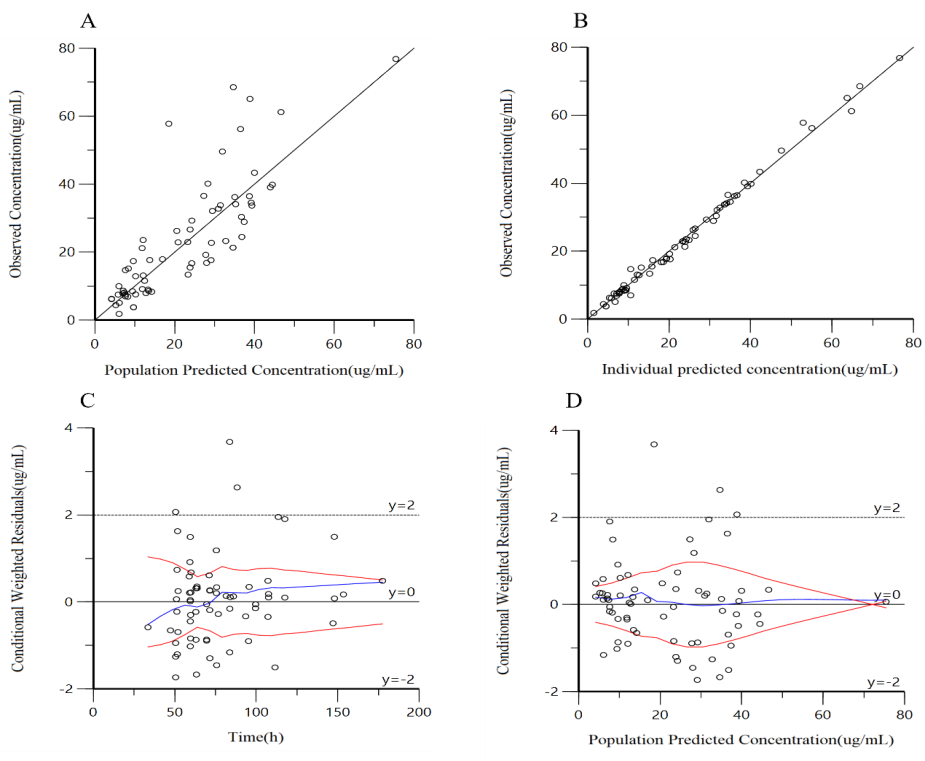
A: actual observations vs. population predictions, B: actual observations vs. individual predictions, C: conditionally weighted residuals vs. time, D: conditionally weighted residuals vs. population predictions
FIGURE 4
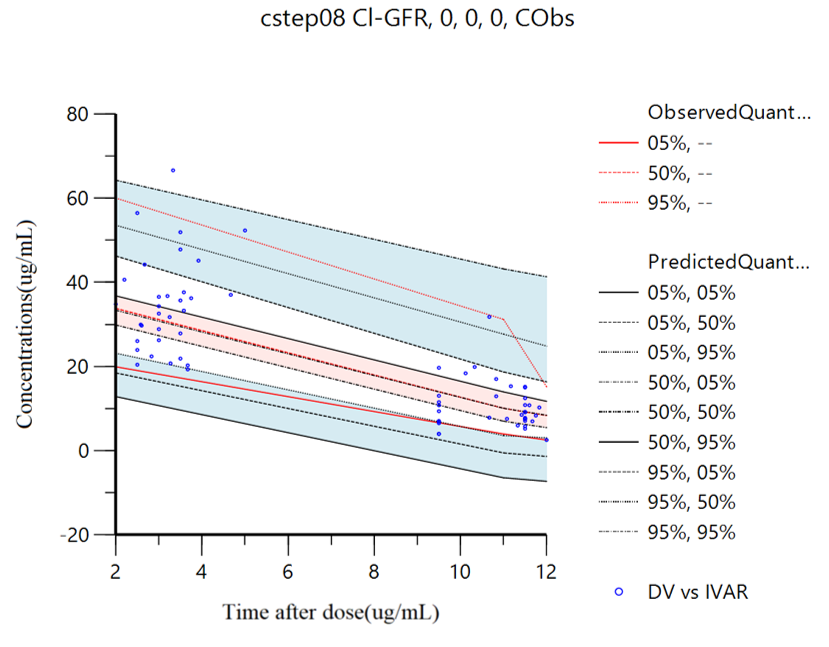
Figure 4: VPC Diagram of the Final Model of PPK
Tables at a glance
Figures at a glance