Table 1: Information on Demographic and Biochemical Indicators
Table 2
Covariate
OFV
ΔOFV
Result (Yes or No)
Model
-
507.633
-
-
M0
Forward addition
-
-
-
-
Sex on V
505.848
1.785
no
M1
Sex on CL
506.258
1.375
no
M2
age on V
507.471
0.162
no
M3
ALB on CL
494.796
12.837
yes
M4
CrCL on CL
492.564
15.069
yes
M5
BUN on CL
499.426
8.207
yes
M6
CYSC on CL
497.238
10.395
yes
M7
GFR on CL
476.775
30.858
yes
M8
SCr on CL
497.949
9.684
yes
M9
ESR on CL
500.015
7.618
yes
M10
CRP on CL
500.31
7.323
yes
M11
HCT on CL
500.323
7.31
yes
M12
WT on V
506.61
1.023
no
M13
CL-GFR chosen
476.775
M14
Forward addition
-
-
-
-
V-sex- Cl-GFR
475.289
1.486
no
M15
Cl-sex-Cl-GFR
476.687
0.088
no
M16
V-age-Cl-GFR
476.441
0.334
no
M17
CL-ALB-Cl-GFR
475.105
1.67
no
M18
CL-CrCL-Cl-GFR
476.753
0.022
no
M19
CL-BUN-Cl-GFR
476.198
0.577
no
M20
CL-Cysc-Cl-GFR
474.058
2.717
no
M21
CL-Scr-Cl-GFR
476.696
0.079
no
M22
CL-ESR-Cl-GFR
475.772
1.003
no
M23
CL-CRP-Cl-GFR
473.078
3.697
no
M24
CL-HCT-Cl-GFR
476.74
0.035
no
M25
V-WT-CL-GFR
475.757
1.018
no
M26
Table 2: Covariate Modeling Process
Table 3
Parameter
Base Model
Final Model
Bootstrap
Estimate
RSE (%)
Estimate
RSE (%)
Median
95%CI
CL(L/h)
3
7.73
3.12
5.32
3.11
2.80~3.44
V(L)
20.31
10.62
20.41
10.05
20.49
16.44~24.98
θGFR,CL
-
-
1.15
10.51
1.14
0.92~1.53
ωCL2(%)
0.21
19.91
0.09
26.83
0.08
-
ωV2 (%)
0.19
35.07
0.17
34.89
0.16
-
ε (%)
2.76
30.01
2.95
28.64
2.93
0.01~4.61
Table 3: Parameter Estimates for the Base and Final Models and Bootstrap Results
Table 4
GFR (ml/min)
Recommendations
Daily dose
PTA (%)
40~50
0.5 g q12h
1 g
52.9
60~70
1 g q24h
1 g
56.4
80~90
0.5 g q8h
1.5 g
57.5
90~100
0.5 g q8h
1.5 g
55.5
100~110
0.5 g q6h
2.0 g
54.3
110~120
0.5 g q6h
2.0 g
59.6
120~130
1 g q12h
2.0 g
58.1
130~140
0.5 g q6h
2.0 g
56.9
140~150
1 g q12h
2.0 g
52.5
Table 4: Recommended Dosing Regimens for Target AUC/MIC of 400 To 600
Note: Recommendations: recommended dosing regimen, Daily dose: daily dose, PTA: probability of goal attainment.
Tables at a glance
Table 1Table 2Table 3Table 4
Figures at a glance
Figure 1Figure 2Figure 3Figure 4
FIGURE 1
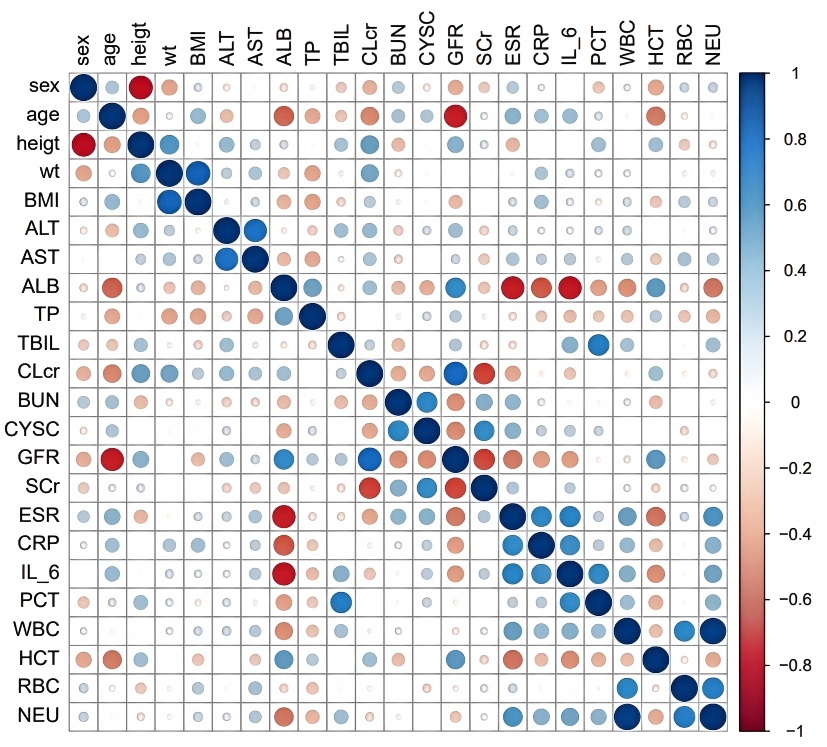
Figure 1: Correlation Analysis of Covariates
FIGURE 2
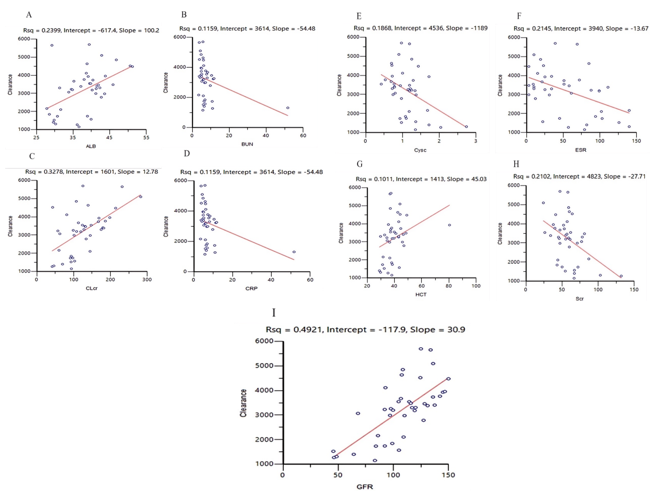
Figure 2: Correlation Analysis between Base Model Clearance and Covariates
FIGURE 3
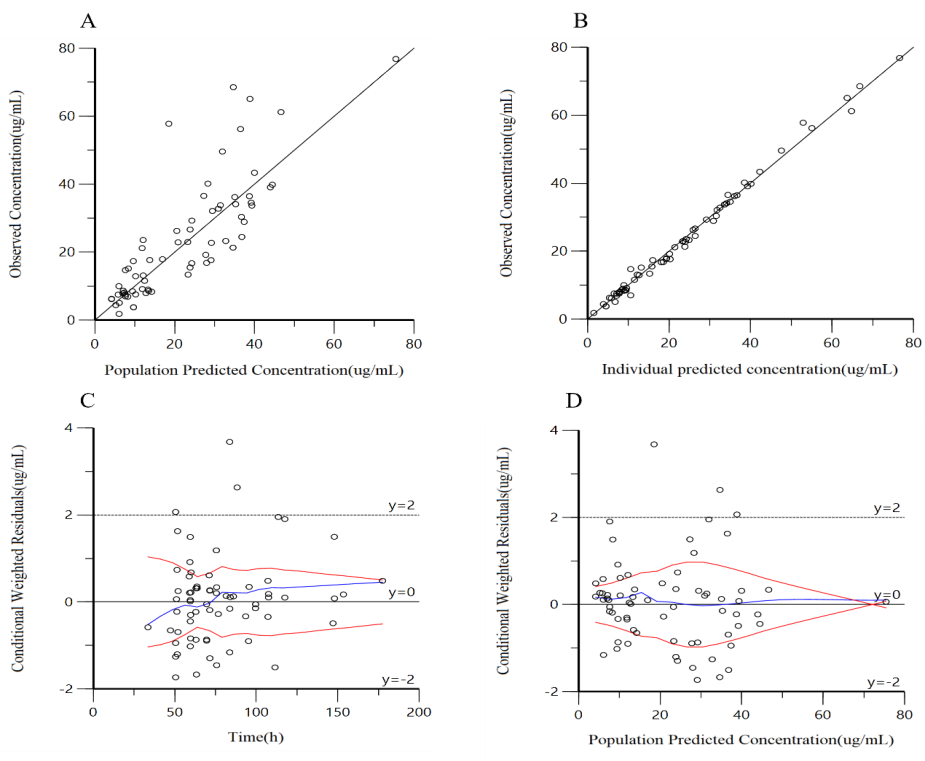
A: actual observations vs. population predictions, B: actual observations vs. individual predictions, C: conditionally weighted residuals vs. time, D: conditionally weighted residuals vs. population predictions
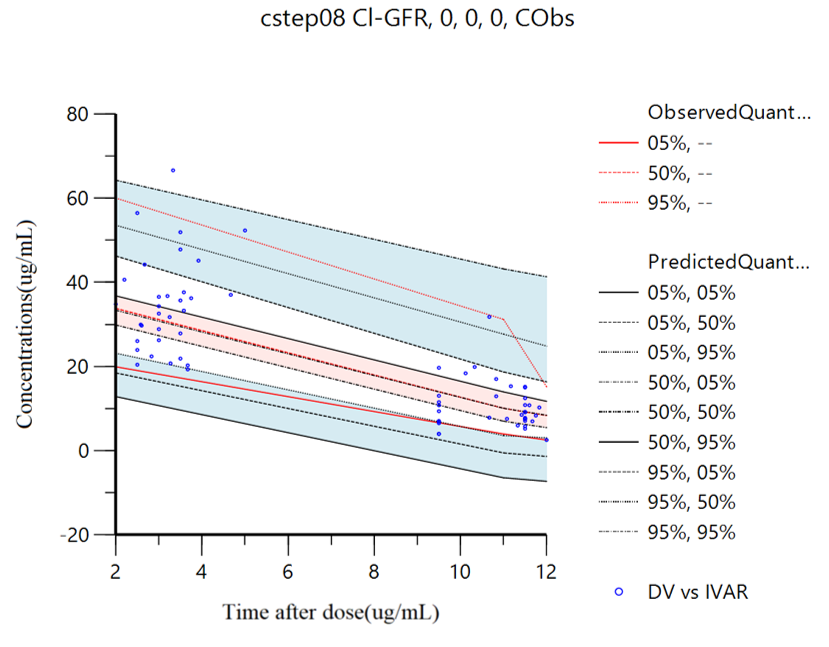
Tables at a glance
Figures at a glance