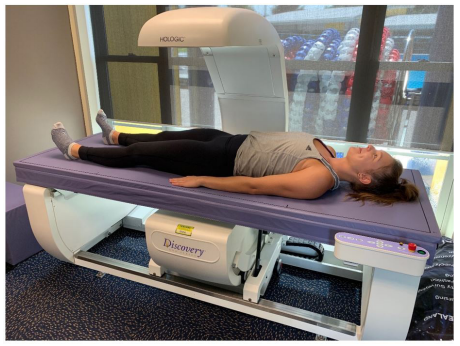
Figure 1: Pictorial representation of the DEXA equipment utilised in this study
Demographics |
All Participants |
Age (yr) |
32.3 ± 7.70 |
Height (cm) |
166.5 ± 5.90 |
Body mass (kg) |
69.1 ± 23.2 |
|
24.6 ± 7.70 |
Body fat (%) |
27.5 ± 6.70 |
Table 1: Baseline characteristics of the participants (mean ± SD)
Test – retest reliability |
Mean ±SD |
ICC AvgMea |
95% CI |
CV % |
Qualitative Inference |
|
Test 1 |
Test 2 |
|||||
Femoral Neck |
||||||
Neck BMC (g) |
4.74 ±0.63 |
4.70 ±0.76 |
0.98s |
0.94 to 0.99 |
2.01 |
Excellent |
Neck BMD (g/cm2) |
0.95 ±0.11 |
0.96 ±0.11 |
0.99s |
0.97 to 1.00 |
1.12 |
Excellent |
Total BMC (g) |
37.2 ±6.25 |
37.2 ±6.27 |
1.00s |
0.99 to 1.00 |
1.12 |
Excellent |
Total BMD (g/cm2) |
1.07 ±0.12 |
1.07 ±0.12 |
1.00s |
0.99 to 1.00 |
0.64 |
Excellent |
Lumbar Spine (L1 - L4) |
||||||
Total BMC (g) |
72.2 ±8.91 |
73.5 ±9.02 |
1.00s |
0.99 to 1.00 |
0.70 |
Excellent |
Total BMD (g/cm2) |
1.16 ±0.15 |
1.15 ±0.15 |
0.99s |
0.98 to 1.00 |
1.08 |
Excellent |
Hip Structural Analysis |
||||||
Narrow Neck CSA (cm2) |
3.50 ±0.51 |
3.52 ±0.58 |
0.91s |
0.98 to 1.00 |
1.56 |
Excellent |
Narrow Neck Z (cm3) |
1.64 ±0.32 |
1.64 ±0.31 |
0.99s |
0.97 to 1.00 |
1.88 |
Excellent |
Narrow Neck Cort. Thick. (cm) |
0.23 ±0.03 |
0.23 ±0.03 |
0.99s |
0.95 to 1.00 |
1.45 |
Excellent |
Body Composition |
|
|
|
|
|
|
Total Body Fat Mass (g) |
20630 ±9019 |
20409 ±9107 |
1.00s |
0.99 to 1.00 |
1.23 |
Excellent |
Total Body Lean + BMC (g) |
52021 ±7793 |
52179 ±7837 |
1.00s |
0.99 to 1.00 |
0.69 |
Excellent |
Total Body Mass (g) |
72586 ±15343 |
72588 ±15441 |
1.00s |
1.00 to 1.00 |
0.32 |
Excellent |
Total Body Fat (%) |
27.5 ±6.70 |
27.2 ±6.77 |
1.00s |
0.99 to 1.00 |
1.23 |
Excellent |
Table 2: Test-retest reliability of DEXA for left hip and lumbar spine (L1 - L4) BMD,
BMC, hip structural analysis (left hip only) and total body composition measures
Key: ICC Intraclass correlation coefficient; AvgMea Average measures; s
p < 0.001;
CV Coefficient of Variation; BMC Bone mineral content; BMD Bone mineral density;
CSA Cross sectional area; Z Section modulus; Cort Cortical; Thick Thickness
Tables at a glance
Figures at a glance