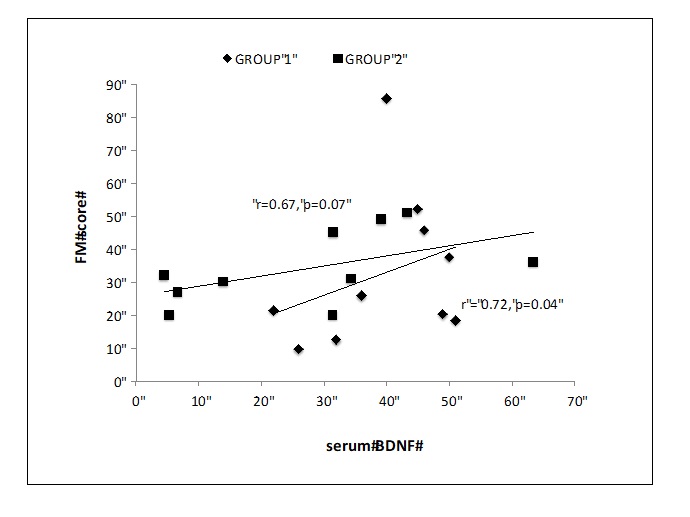
Figure 1:Correlation of BDNF with FM scores at 8 weeks in both groups.
Figure 1:Correlation of BDNF with FM scores at 8 weeks in both groups.

Figure 2: Correlation of VEGF with FM scores at 8 weeks in both groups.

Figure 3:Correlation of VEGF and laterality index of BA6 in both groups.

Figure 4:BOLD imaging of group 1 subjects : a) Pre treatment B) post treatment
Tables at a glance
Figures at a glance