FIGURE 1
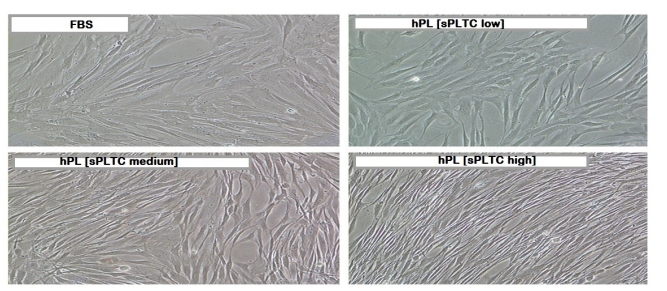
Figure 1: Representative microscope image of cells grown under four different conditions (magnification 10X). Cells grown in platelet lysate are smaller and elongated compared to cells grown in FBS. The effect is more pronounced for the high concentration hPL condition [high sPLTC (4x10⁹sup> PLT/ml)]. FBS= Fetal Bovine Serum, hPL SPLTC = human platelet lysate starting platelets concentration.
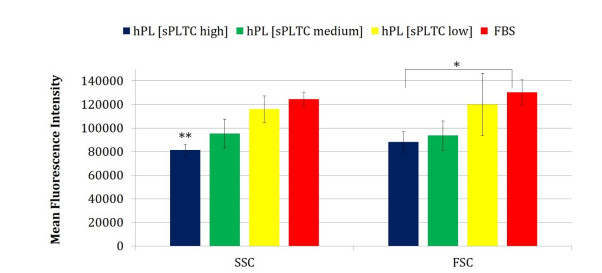
Chart 1: The chart shows the MFI (Mean Fluorescence Intensity) of the physical parameters FSC and SSC under 4 different culture conditions. Statistical analysis was conducted using ANOVA (Analysis of Variance) and significance was found for the FSC parameter with *p < 0.05 (=0.001). Additionally, a paired t-test was performed between the FBS and the high sPLTC platelet lysate condition, and significance was also found for the SSC parameter (significance with ** p < 0.05 = 0.001). Data are represented as mean ±SD (n=420)
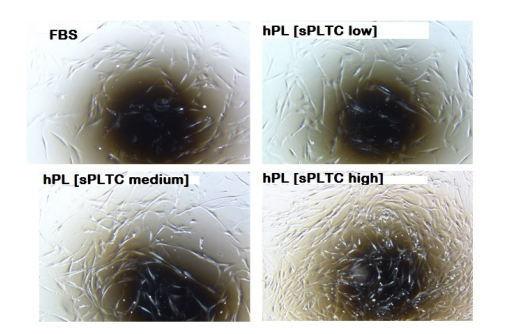
Figure 2: Representative microscope (4X) image of cells grown under 4 different conditions and observed after 72 hours of culture at passage 2. Cells grown in high sPLTC concentration hPL have a higher proliferative boost than other culture conditions. FBS= Fetal Bovine Serum, hPL SPLTC = human platelet lysate starting platelets concentration.
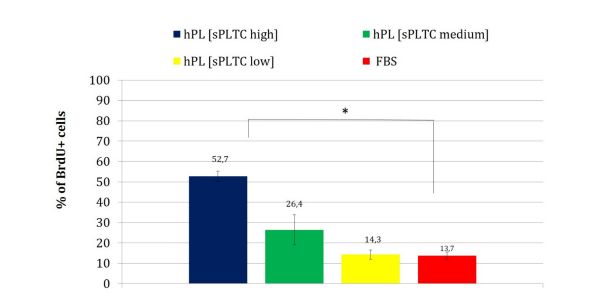
Chart 2: The chart presents the percentage of BrdU-positive cells (S-phase cells in active proliferation), after 72 hours of culture at passage 2.Data are represented as mean ±SD with n= 84. Statistical analysis was performed with one way ANOVA test (significance with * p < 0.05,p=0.0002). FBS= Fetal Bovine Serum, hPL sPLTC = human platelet lysate starting platelets concentration.
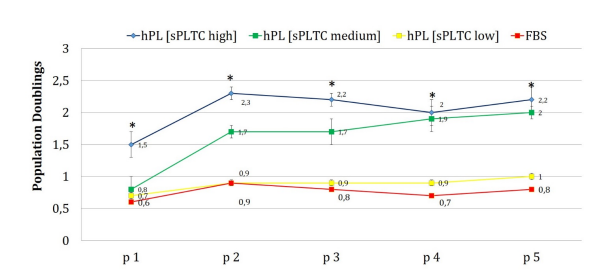
Chart 3: The chart represents the population doubling (PD) of MSCs grown in DMEM 5% platelet lysate at three different starting platelets concentration (high, medium, low) and MSCs grown in DMEM 10% FBS. Cells grown in platelet lysate, especially at high and medium starting platelets concentration, had a significantly higher proliferative potential, particularly at early passages. Cells cultured in FBS and low sPLTC lysate, follow a similar trend along the different culture passages. Data are represented as mean ±SD with n=420. Statistical analysis was performed with one way ANOVA test (significance with * p < 0.05, p=0.00001). FBS= Fetal Bovine Serum, hPL sPLTC = human platelet lysate starting platelets concentration.
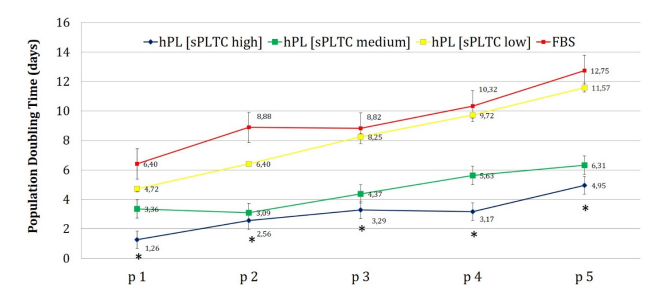
Chart 4: The chart represents the population doubling time (PDT) of MSCs grown in DMEM 5% platelet lysate at the three different platelets concentration and MSCs grown in DMEM 10% FBS. Cells grown in sPLTC and high sPLTC platelet lysate, from p1 to p5, take half time to double their population compared to cells grown in FBS and low sPLTC PL. This trend is most visible at early culture passages where cells grown in FBS take five times longer than cells grown in high sPLTC platelet lysate to double their population. Data are reported as mean ±SD n=420. Statistical analysis was performed with one way ANOVA test (significance with *p < 0.05, p=0.00001). FBS= Fetal Bovine Serum, hPL SPLTC = human platelet lysate starting platelets concentration.
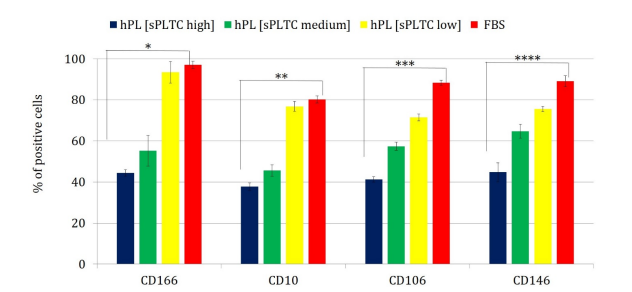
Chart 5: The chart shows the percentage of cells expressing the CD10, CD 106, CD 166 and CD146 markers in the 4 different culture conditions. Statistical analysis was performed with one way ANOVA test, and significance was found for all the analyzed parameters. Significance of the test with p < 0,05 (*p CD166 =0,004, **p CD10 =0,036, ***p CD106 = 0,001,****p CD146 =0,0024). Data are presented as mean ±SD n=420 (calculated from p1 to p5), FBS= Fetal Bovine Serum, hPL sPLTC = human platelet lysate starting platelets concentration.
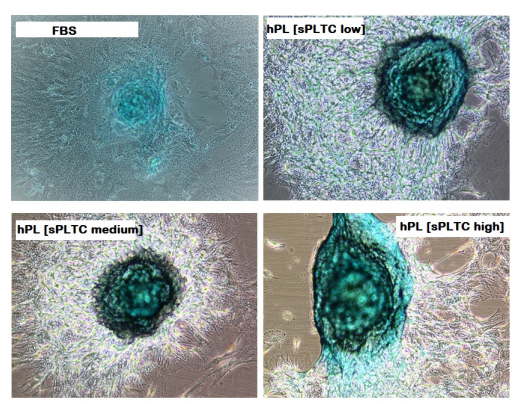
Figure 3: Representative case of MSC chondrogenic differentiation at p5 in 4 different culture conditions. Alcian blue staining shows hyaluronic acid for chondrocytes, after 15 days of induction. n= 84 FBS= Fetal Bovine Serum, hPL sPLTC = human platelet lysate starting platelets concentration
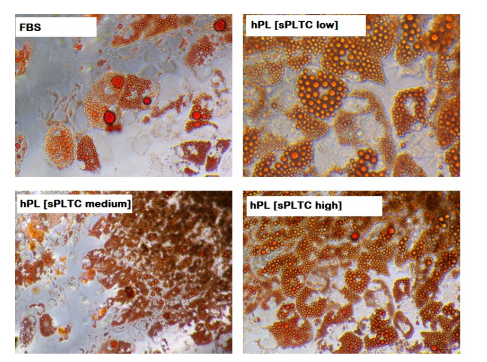
Figure 4: Representative case of MSC adipogenic differentiation at p5 in 4 different culture conditions. Oil Red O shows intracytoplasmatic vacuoles, after 15 days of adipogenic induction. n= 84 FBS= Fetal Bovine Serum, hPL sPLTC = human platelet lysate starting platelets concentration
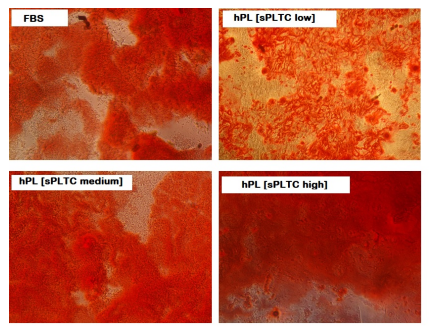
Figure 5: Representative case of MSC osteogenic differentiation at p5 in 4 different culture conditions. Alizarin Red S staining shows the presence of calcium matrix in osteoblasts, after 21 days of osteogenic induction. n= 84 FBS= Fetal Bovine Serum, hPL sPLTC = human platelet lysate starting platelets concentration.
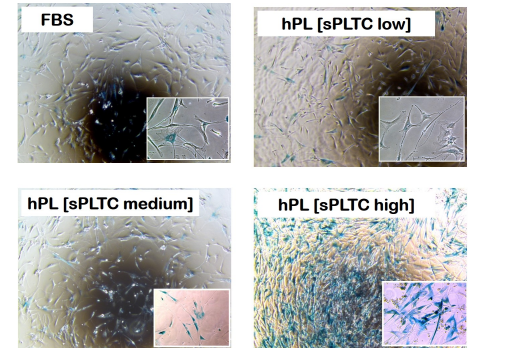
Figure 6: Representative case of histochemical detection of Senescence-associated marker β-galactosidase on MSC at passage 5, in 4 different culture conditions. n= 84 FBS= Fetal Bovine Serum, hPL sPLTC= human platelet lysate starting platelets concentration.
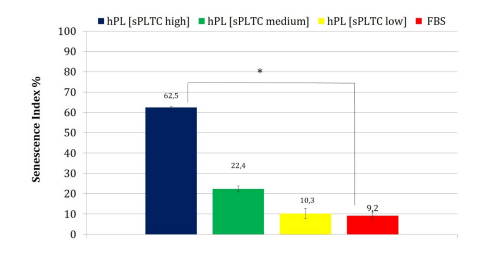
Chart 6: The chart shows the senescence index of MSC in the 4 different culture conditions at p5. The high sPLTC hPL condition shows a significant increase in senescent cells (one way ANOVA test with n= 84 and *p= 0.00001 Data are represented as mean ±SD FBS= Fetal Bovine Serum, hPL sPLTC = human platelet lysate starting platelets concentration.
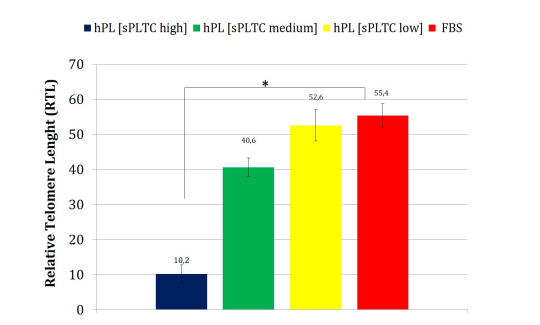
Chart 7: The chart shows the relative telomere length (RTL) of MSCs in the 4 different culture conditions at p5. The high sPLTC hPL condition shows a significant reduction of RTL (one way ANOVA test with n= 84 and *p= 0.00002 Data are represented as mean ±SD FBS= Fetal Bovine Serum, hPL SPLTC = human platelet lysate starting platelets concentration.
Tables at a glance
Figures at a glance