Variable
Reference Range
Result
Blood
White‑cell count (per mm³)
4500–11,000
5400
Polymorph nuclear cells (%)
40–70
75
Lymphocytes (%)
22–44
25
Hemoglobin (g/dl)
12.0–16.0
12.5
Hematocrit (%)
36.0–46.0
39
Platelet count (per mm³)
150,000–400,000
175000
Sodium (mmol/liter)
135–145
138
Potassium (mmol/liter)
3.4–5.0
4
Urea nitrogen (mg/dl)
8–25
30
Creatinine (mg/dl)
0.60–1.50
1.36
Glucose (mg/dl)
70–110
95
Lactic acid (mmol/liter)
0.5–2.2
Aspartate aminotransferase (U/liter)
9–32
23
Alanine aminotransferase (U/liter)
7–33
19
Alkaline phosphatase (U/liter)
30–100
220
Bilirubin (mg/dl) Total Direct
0.0–1.0 0.0–0.4
0.8 0.27
CEA (ng/ml)
Less than 5-10
1.08
Alfa fetoprotein (U/ml)
Up to 5.5
1.0
TSH (ng/ml)
0.35-4.94
4.7
ESR (mm)
5-12
105
Urine
Specific gravity
Not Defined
Leukocyte esterase
Negative
Nitrite
Urobilinogen
Ketones
Sediment (per high‑power field) Red cells White cells
0–2 0–2
Table 1 : The laboratory data
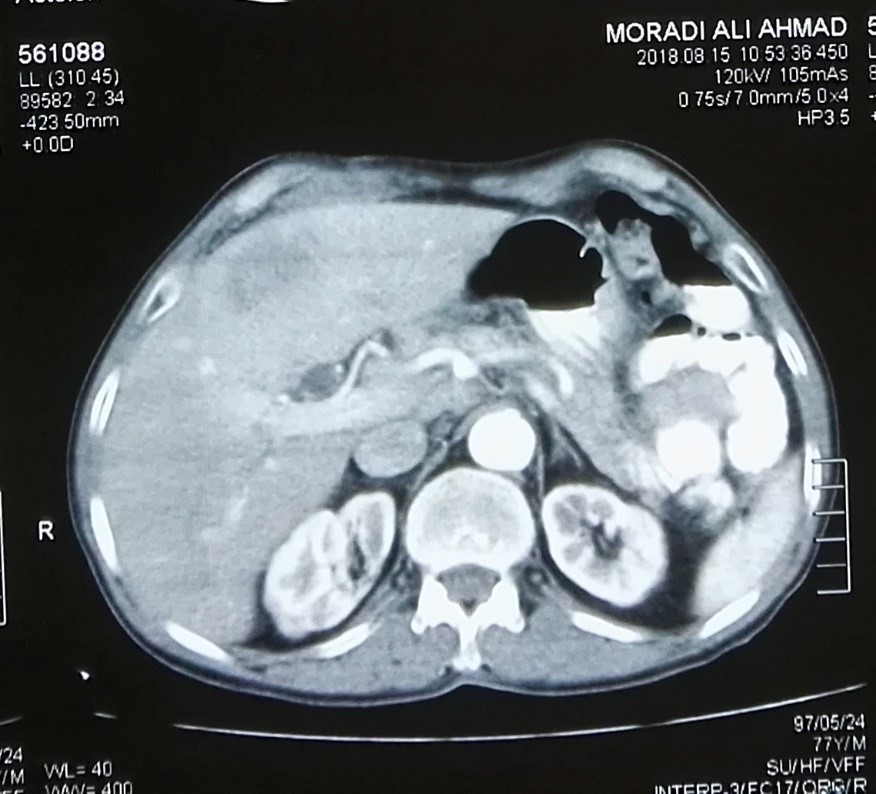
Figure1: The computed tomography demonstrating the gallbladder
Tables at a glance
Figures at a glance