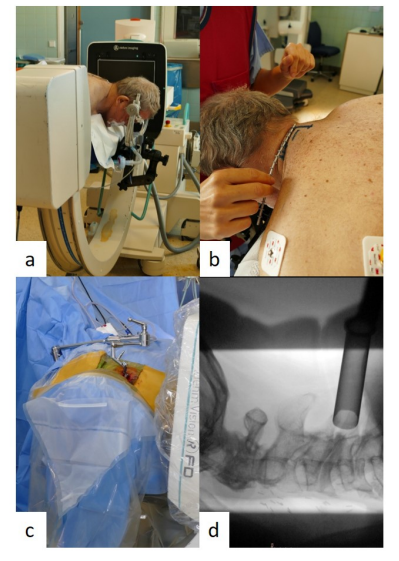
Figure 1: Positioning of the patient (a), marking of the skin incision (b), lateral fluoroscopy after tube insertion (c), verification of the correct tube position (d)
Figure 1: Positioning of the patient (a), marking of the skin incision (b), lateral fluoroscopy after tube insertion (c), verification of the correct tube position (d)
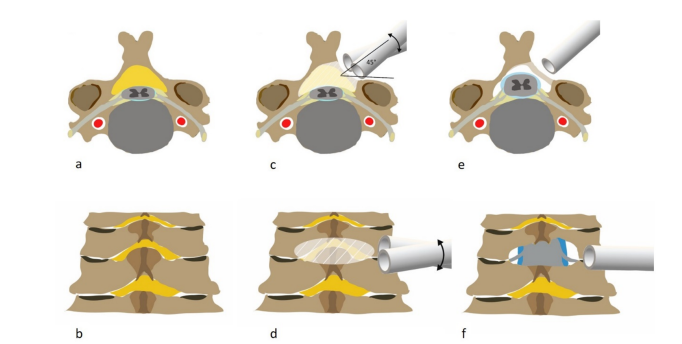
Figure 2: Posterior cervical stenosis in axial view (a). Posterior view of the cervical spine (b). Pivoting of the tubular system in axial and posterior views (c and d). The margins of bony resection are marked. Postoperative results in axial (e) and posterior (f) views, with sufficient decompression (the posterior tension band is preserved but is not illustrated for better visualization)
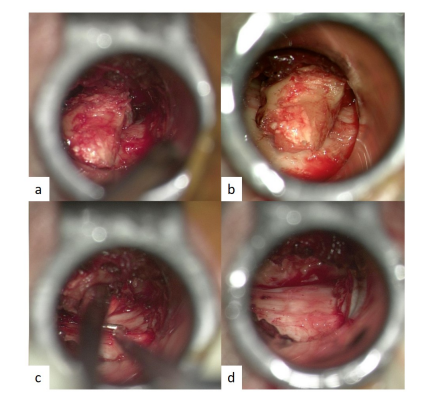
Figure 3: View through the tubular system under magnification. Results after ipsi and contralateral bony decompression (a and b). Palpation with microinstruments to assure sufficient decompression (c). Contralateral view on the decompressed dura (d)
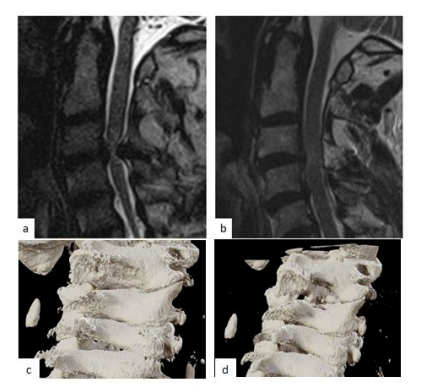
Figure 4: (a) Pre and postoperative (b) magnet resonance imaging in sagittal view and 3d reconstruction of the bony structures pre- (c) and postoperative (d) (Brainlab Iplan)
Tables at a glance
Figures at a glance