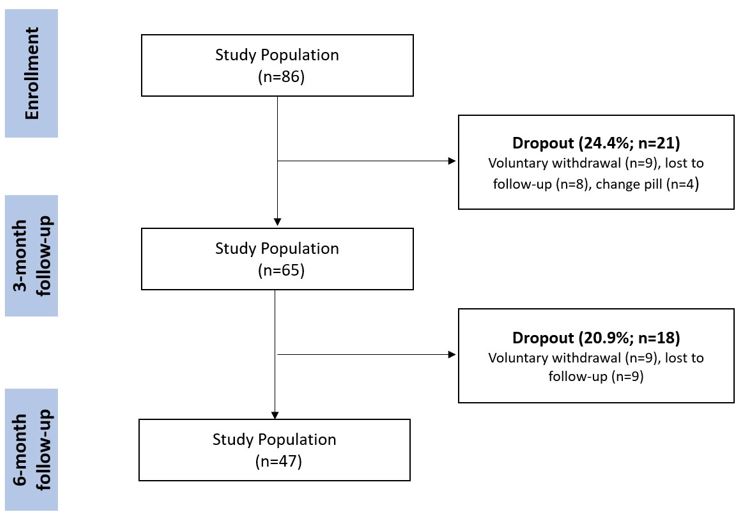
Figure 1: Flow diagram of the study, schematizing the women progress
Figure 1: Flow diagram of the study, schematizing the women progress
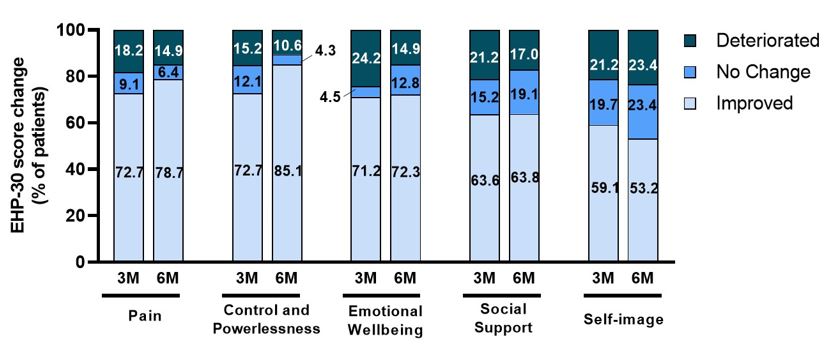
Figure 2: Changes in core EHP-30 scores from baseline to month 3 (3M) and to month 6 (6M) Results demonstrate proportions of patients with deterioration, no change and improvement defined as >0, 0 and < 0 difference in EHP-30 scores between baseline and questionnaires at month 3 and 6. Data were analyzed in 66 and 47 patients after 3- and 6-months follow-up, respectively. EHP-30, Endometriosis Health Profile-30 questionnaire
Tables at a glance
Figures at a glance