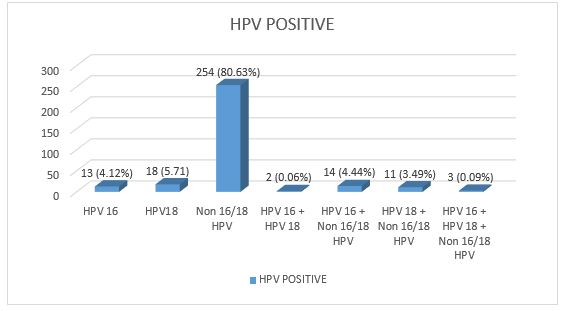
Figure 1: Distribution of HR HPV types among infected women (single serotype and coinfections)
Variables |
Categories |
Number |
Proportion (%) |
Age groups |
30–34 |
200 |
26.6 |
35 – 39 |
175 |
23.2 |
|
40–44 |
141 |
18.7 |
|
45–49 |
85 |
11.3 |
|
50–54 |
56 |
7.45 |
|
55+ |
95 |
12.63 |
|
Years of Education |
≤7 |
193 |
25.66 |
8 – 12 |
158 |
21.01 |
|
13 – 15 |
133 |
17.68 |
|
>15 |
172 |
22.87 |
|
No data: |
96 |
12.76 |
|
Marital status |
Married |
516 |
68.62 |
Single |
157 |
20.88 |
|
Divorced/ Separated |
16 |
2.13 |
|
Widowed |
52 |
6.91 |
|
Age at first Coitus |
≤17 |
204 |
40,80 |
18 – 20 |
215 |
43,00 |
|
21+ |
81 |
16,20 |
The most representation occupations were traders (22.8%), homemakers (18%) and teachers (17.24%)
Table 1 : Socio-demographic data: Age, education, marital status and age at first coitus
Occupation |
Number |
Proportion (%) |
Hair Dresser |
31 |
4.12 |
Sex Worker |
1 |
0.13 |
Housewife |
137 |
18.22 |
Farmer |
37 |
4.92 |
Health Care Worker |
28 |
3.72 |
Secretary |
17 |
2.26 |
Trader |
173 |
23.01 |
Teacher |
129 |
17.15 |
Student |
18 |
2.39 |
Seamstress |
42 |
5.59 |
Domestic Worker |
18 |
2.39 |
Others |
108 |
14.36 |
No data |
13 |
1.73 |
Others = Civil servants, Pastors, lawyers
Table 2 : Distribution of participants as per occupation (N = 752)
Variables |
Categories |
Number |
Proportion (%) |
Parity |
≤ 2 |
291 |
38.04 |
3-4 |
260 |
33.99 |
|
5-6 |
156 |
20.39 |
|
7+ |
58 |
7.58 |
|
HIV status |
Positive |
133 |
17.69 |
Negative |
579 |
76.99 |
|
Unknown |
40 |
5.32 |
|
HIV positive on treatment |
Yes |
100 |
75 |
No |
33 |
25 |
Table 3 : Obstetric and medical parameters of participants
HPV sample type |
HPV Positive |
HPV negative |
RR (CI) |
P value |
Self-collected (n=630) |
268 (42.54%) |
362 (57.46%) |
1.10 ( 0.87-1.41) |
0,4217 |
Provider collected (n=122) |
47 (38.52%) |
75 (61.48%) |
There was a small difference in terms of HR HPV prevalence between self-collected and provider-collected samples with a relative risk of HR
HPV positivity for self-collection slightly greater than one. This was however not statistically significant (P value = 0.4107)
Table 4 : High-risk HPV DNA testing with respect to sampling type
Predictor Variable |
Categories |
HPV positive |
HPV Negative |
RR (95%CI) |
P value |
Age at first coitus |
≤ 17 years |
91 (44.61%) |
113 (55.39%) |
1.10 (0.90-1.35) |
0.3629 |
18 years + |
120 (40.54%) |
176 (59.46%) |
|||
Parity |
≤ 2 |
132 (45.83%) |
156 (44.17%) |
1.16 (0.98-1.38) |
0.0810 |
3+ |
183 (39.44%) |
281 (60.56%) |
|||
HIV Status |
Positive |
91 (68.42%) |
42 (31.58%) |
1.88 (1.60-2.20) |
0.00001 |
Negative |
211(36.44%) |
368 (63.56%) |
|||
Marital status |
Married |
209 (40.50%) |
307 (59.50%) |
0.90 (0.76-1.08) |
0.2490 |
Single |
106 (44.92%) |
130 (55.08%) |
|||
Level of education |
< 8 years |
80 (39.60%) |
122 (60.40%) |
0.91 (0.74-1.11) |
0.3444 |
≥ 8 years |
198 (43.61%) |
256 (56.39%) |
Age at sexarche (first coitus) less than 18 years, parity of three or greater, marital status and level of education below eight years were not associated with a higher risk of HR HPV infection. HR HPV prevalence among HIV positive women was 68.4% against 36.4% amongst HIV negative women
Table 5 : Factors and their influence on HPV infection
Figure 1: Distribution of HR HPV types among infected women (single serotype and coinfections)
Tables at a glance
Figures at a glance