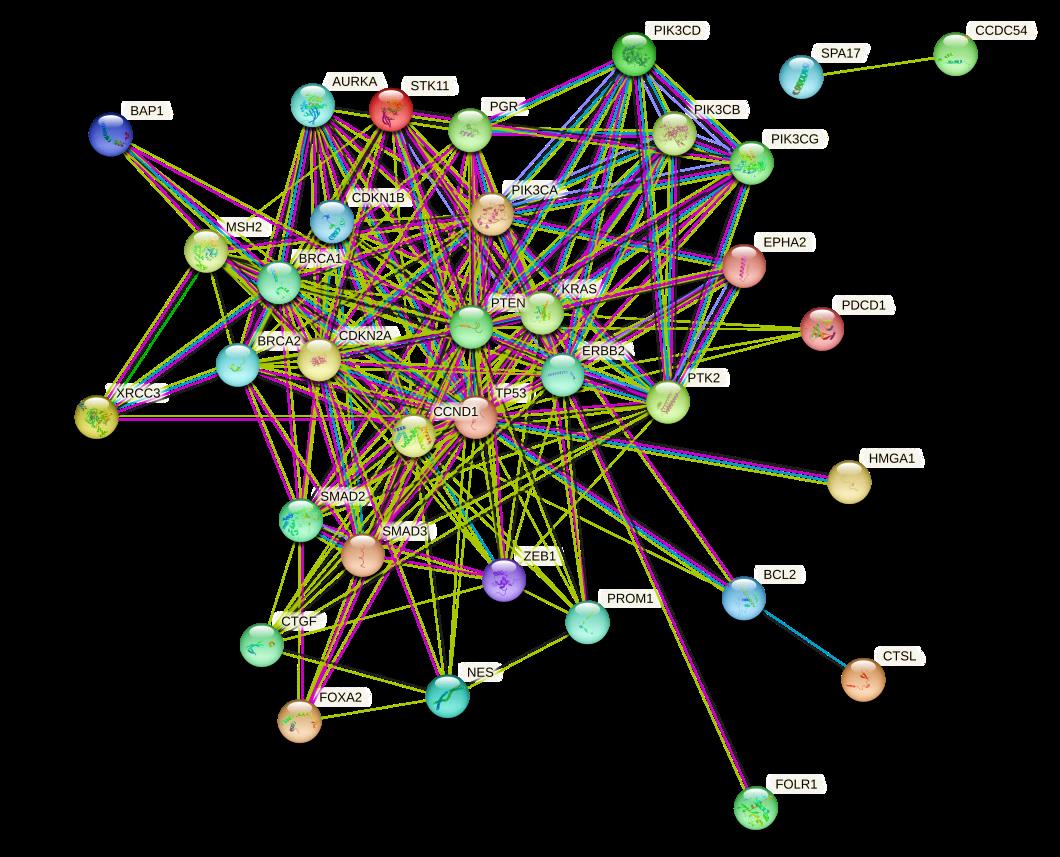
Figure 1: Protein-Protein interaction (PPI) network using string for 35 common genes amongst PCOS, uterine, ovarian and cervical, and breast cancers
Figure 1: Protein-Protein interaction (PPI) network using string for 35 common genes amongst PCOS, uterine, ovarian and cervical, and breast cancers
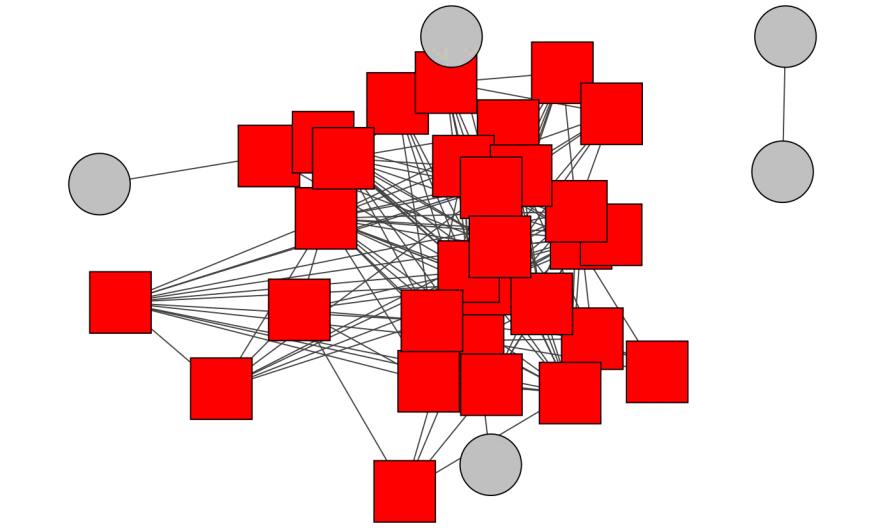
Figure 2: ClusterONE results obtained by analyzing the Network
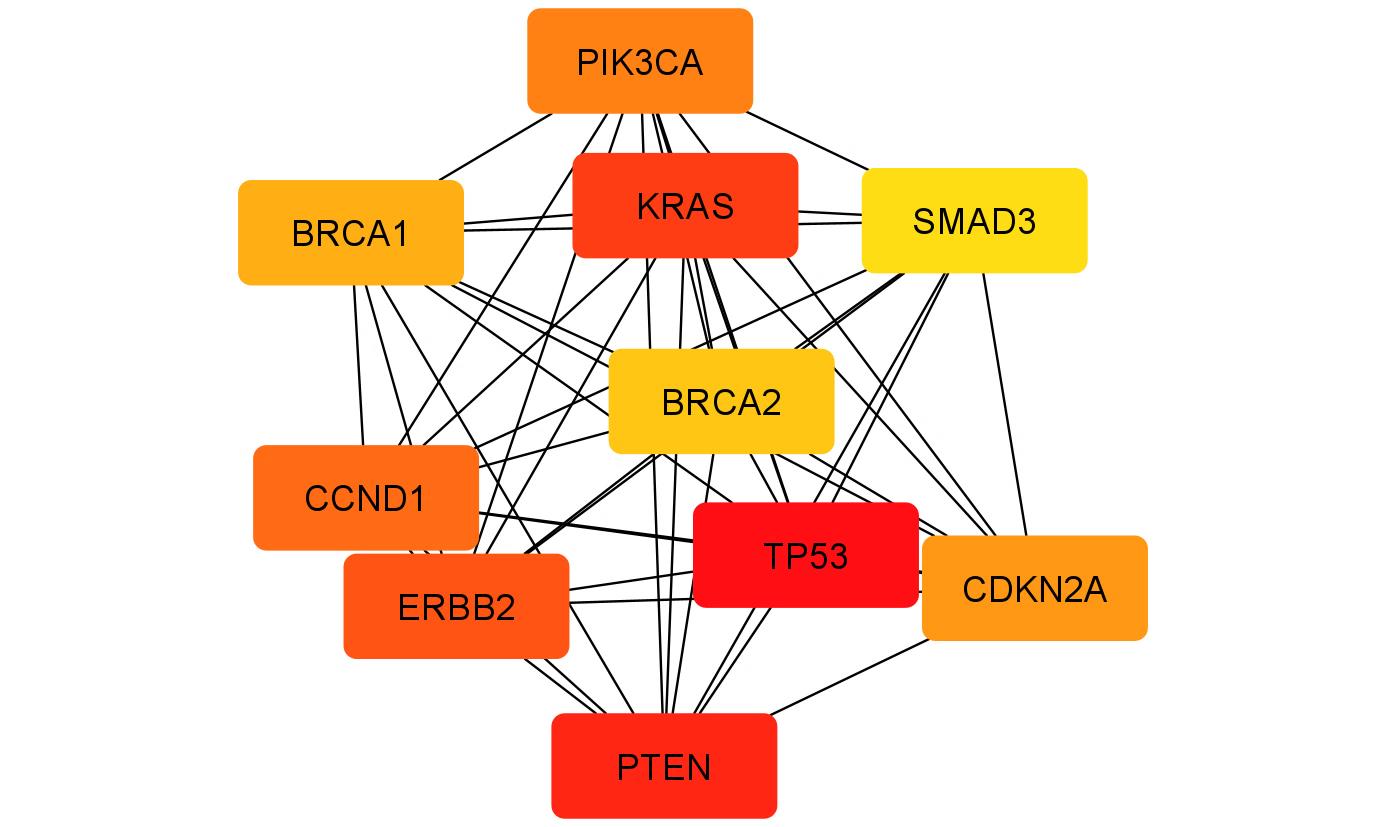
Figure 3: Graphical view of ranked hub nodes obtained from Cytoscape plug-in Cytohubba
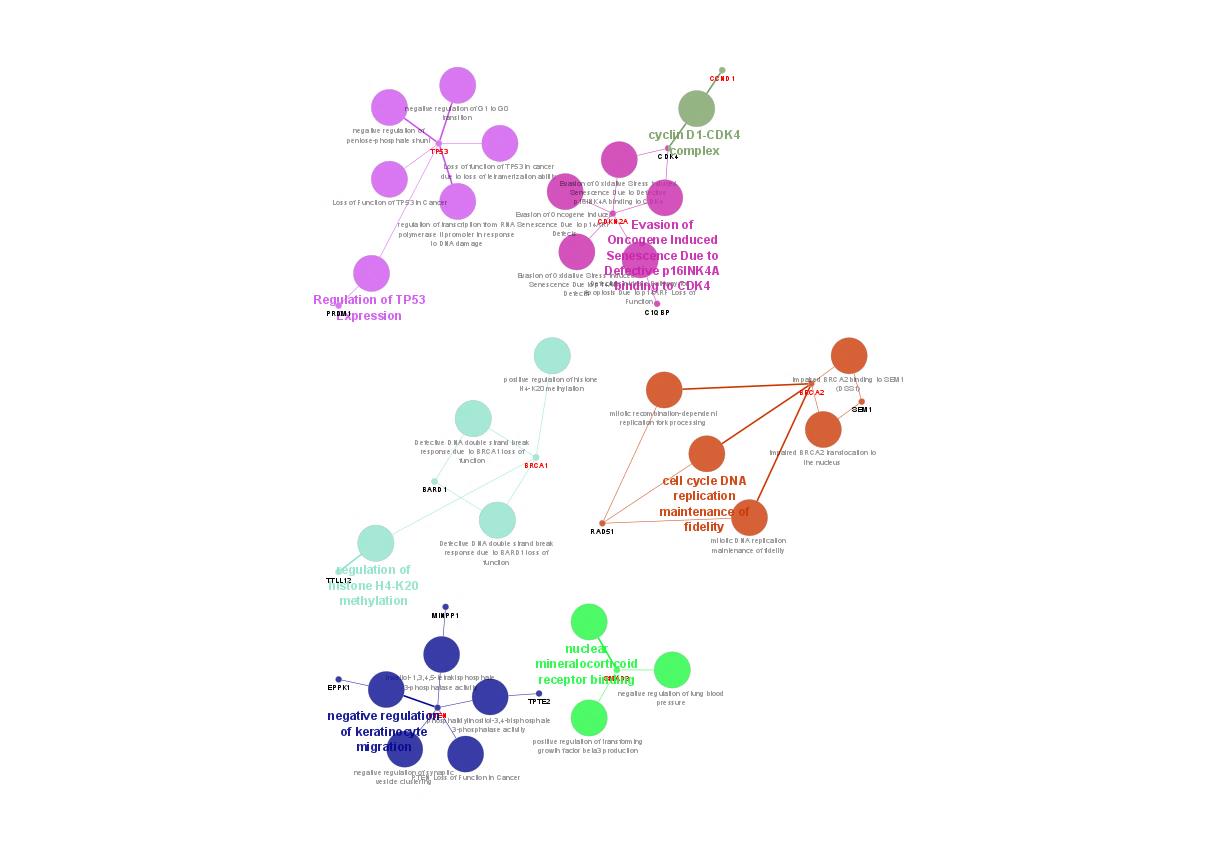
Figure 4: Pathways crosstalk and functional map obtained using Cytoscape plug-in ClueGo
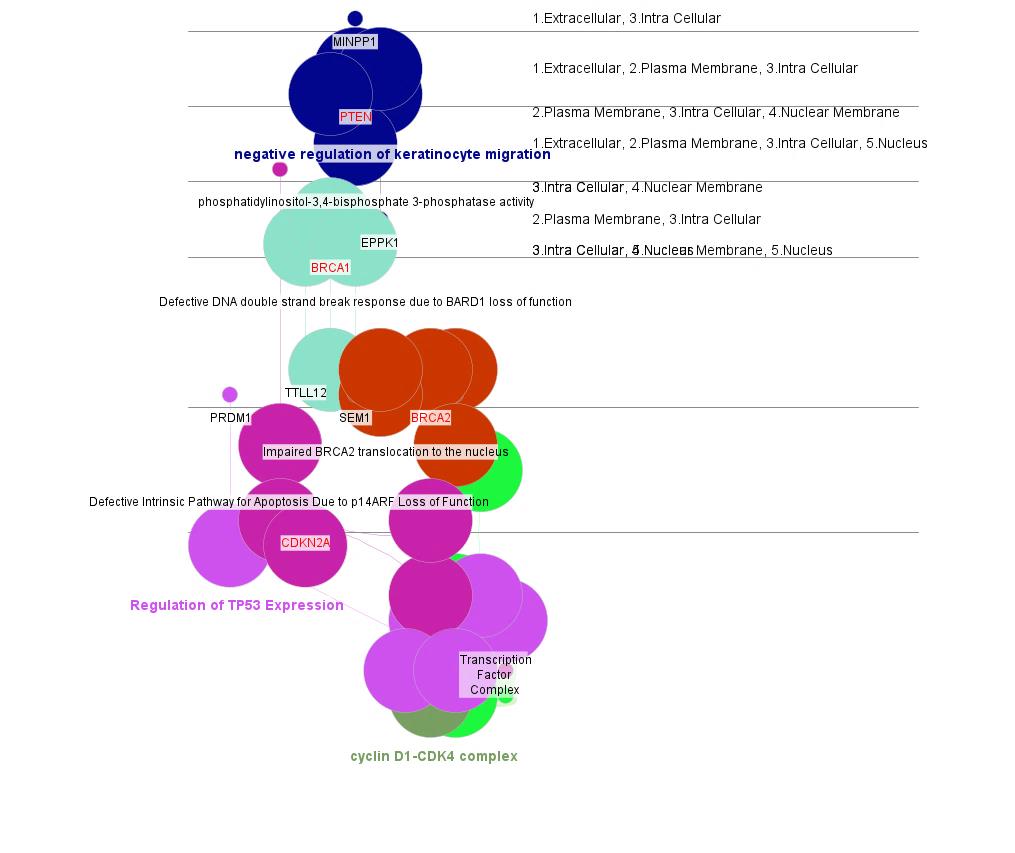
Figure 5: Potential markers and their cellular location obtained from cluepedia plug-in of cytoscape
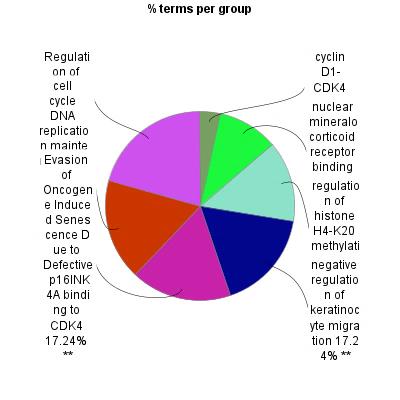
Figure 6: Pie-Chart showing the output of all the GO groups obtained from Cytoscape plugin ClueGO
Figures at a glance