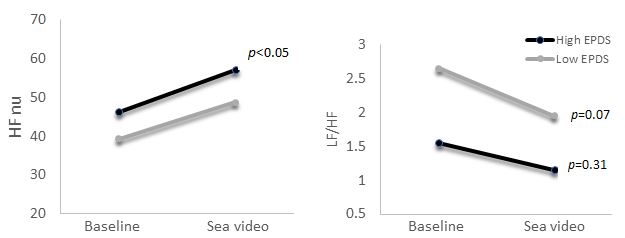
Figure 1: Comparison of heart rate variability (HRV) measures (Left: HFnu, Right: LF/HF) before and after viewing sea video. Gray bars represent the Low EPDS group and black bars represent the High EPDS group
Figure 1: Comparison of heart rate variability (HRV) measures (Left: HFnu, Right: LF/HF) before and after viewing sea video. Gray bars represent the Low EPDS group and black bars represent the High EPDS group
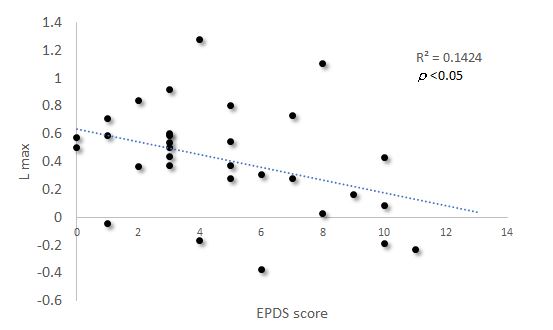
Figure 2: Association between the EPDS score and left frontal lobe brain activity. The amount of brain activity in the left frontal lobe by viewing sea images shows a negative correlation trend with the EPDS score
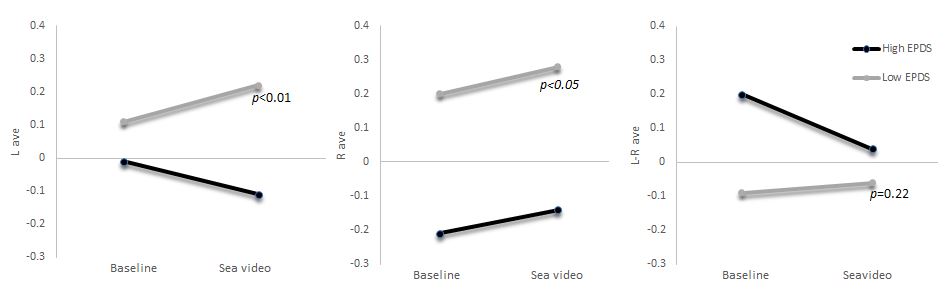
Figure 3: Comparison of brain activity measures before and after viewing the sea video. The graph shows the change in frontal lobe brain activity between baseline and sea video viewing. The left panel shows left frontal lobe brain activity, the center panel shows right frontal lobe brain activity, and the right panel shows the difference between the left and right frontal lobe activities
Tables at a glance
Figures at a glance