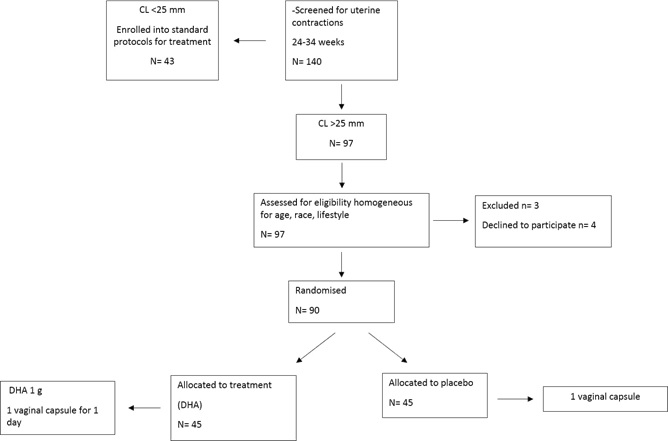
Figure 1 Flow chart for the allocation of the patients.
Figure 1 Flow chart for the allocation of the patients.
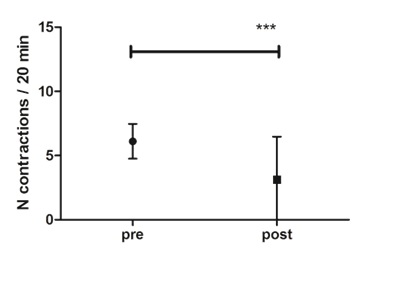
Figure 2 Mean number of contractions before and after treatment with DHA (A group).*** p 0.0001
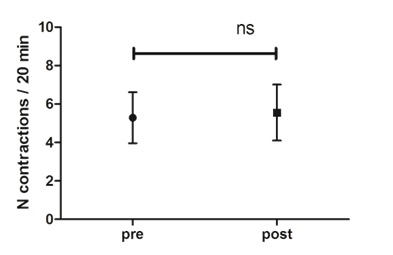
Figure 3 Mean number of contractions before and after placebo (B group).
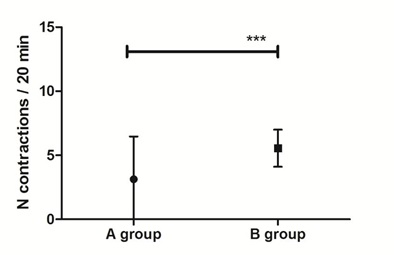
Figure 4 Mean number of contractions after treatment in A group e B group.*** p 0.0001
Frequency of uterine |
No contractions |
Decreasing |
Unchanged |
Increasing |
contractions |
|
|
|
|
|
|
|
|
|
A group n=45 |
20 (44) |
11 (24) |
9 (20) |
5 (11) |
|
|
|
|
|
B group n=45 |
0 (0) |
2 (5) |
28 (62) |
15 (33) |
|
|
|
|
|
P value |
< 0.001 |
< 0.05 |
<0.001 |
< 0.05 |
Table1 Effect of treatment on uterine contractions. Data are presented as number of cases and percentage (%).