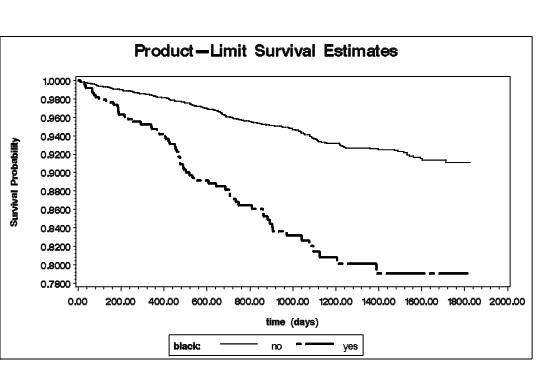
Figure 1 Kaplan-Meier survival estimates by race category (N=4220, p< 0.0001)
Figure 1 Kaplan-Meier survival estimates by race category (N=4220, p< 0.0001)
Variable |
|
Percentage |
Non-Black* |
Black* |
p-value |
Vital status |
Alive |
88.15 |
91.84 |
8.16 |
<.0001 |
|
Dead due to breast cancer |
6.87 |
78.55 |
21.45 |
|
|
Dead due to other reasons |
4.98 |
91.90 |
8.10 |
|
Age at dx |
Age at dx <= 50 |
24.38 |
87.12 |
12.88 |
<.0001 |
|
Age at dx > 50 |
75.62 |
92.16 |
7.84 |
|
Race |
White |
89.16 |
|
|
|
|
Black |
9.07 |
|
|
|
|
Other |
1.76 |
|
|
|
Hispanic |
No |
93.30 |
90.46 |
9.54 |
0.0002 |
|
Yes |
6.70 |
97.14 |
2.86 |
|
Social economic status |
> 20% living below poverty line |
14.15 |
68.30 |
31.70 |
<.0001 |
|
Between 10% and <20% of population living in poverty |
34.19 |
91.45 |
8.55 |
|
|
Between 5% and <10% of population living in poverty |
30.31 |
96.62 |
3.38 |
|
|
< 5% of population living in poverty |
19.17 |
96.90 |
3.10 |
|
|
Unknown |
2.18 |
97.80 |
2.20 |
|
Married |
Unmarried |
46.40 |
87.93 |
12.07 |
<.0001 |
|
Married |
51.40 |
93.76 |
6.24 |
|
|
Unknown |
2.20 |
87.18 |
12.82 |
|
Insurance |
Not insured |
2.61 |
88.99 |
11.01 |
<.0001 |
|
Medicaid |
7.11 |
76.92 |
23.08 |
|
|
Medicare |
35.92 |
94.17 |
5.83 |
|
|
Other insurance |
52.58 |
90.48 |
9.52 |
|
|
Unknown |
1.78 |
97.33 |
2.67 |
|
Total comorbidity |
|
0.99 (1.45) |
0.96 (1.41) |
1.31 (1.80) |
0.0003 |
Table1 Patient characteristics and relation with race (N = 4,220)
* row % or mean (std. dev.)
Variable |
|
Percentage |
Non-Black* |
Black* |
p-value |
ER |
- |
19.55 |
85.52 |
14.48 |
<.0001 |
|
+ |
72.87 |
92.28 |
7.72 |
|
|
Unknown |
7.58 |
91.85 |
8.15 |
|
PR |
- |
34.27 |
87.98 |
12.02 |
<.0001 |
|
+ |
57.89 |
92.67 |
7.33 |
|
|
Unknown |
7.84 |
90.91 |
9.09 |
|
HER2 |
- |
17.94 |
89.23 |
10.77 |
0.2082 |
|
+ |
4.91 |
91.26 |
8.74 |
|
|
Unknown |
77.16 |
91.29 |
8.71 |
|
Triple Negative |
No |
74.91 |
92.24 |
7.76 |
<.0001 |
|
Yes |
2.61 |
72.22 |
27.78 |
|
|
Unknown |
22.49 |
88.71 |
11.29 |
|
Breast surgery |
No surgery |
1.49 |
88.89 |
11.11 |
0.0009 |
|
Mastectomy |
38.70 |
89.78 |
10.22 |
|
|
Other surgery |
51.68 |
92.49 |
7.51 |
|
|
Unknown |
8.13 |
86.76 |
13.24 |
|
Hormone |
No |
78.20 |
90.71 |
9.29 |
0.2581 |
|
Yes |
20.78 |
91.41 |
8.59 |
|
|
Unknown |
1.02 |
97.62 |
2.38 |
|
Radiation |
No |
68.27 |
91.11 |
8.89 |
0.6310 |
|
Yes |
31.02 |
90.62 |
9.38 |
|
|
Unknown |
0.71 |
86.67 |
13.33 |
|
Chemo |
No |
62.04 |
92.78 |
7.22 |
<.0001 |
|
Yes |
35.38 |
87.42 |
12.58 |
|
|
Unknown |
2.58 |
94.50 |
5.50 |
|
Stage |
Localized |
62.42 |
92.86 |
7.14 |
<.0001 |
|
Regional |
28.63 |
88.69 |
11.31 |
|
|
Distant |
4.93 |
81.16 |
18.84 |
|
|
Unknown /un-staged |
4.03 |
88.82 |
11.18 |
|
Grade |
Well-differentiated |
20.45 |
95.33 |
4.67 |
<.0001 |
|
Moderately-differentiated |
38.51 |
92.97 |
7.03 |
|
|
Poorly- or un-differentiated |
41.04 |
86.82 |
13.18 |
|
Histology |
Ductal |
83.29 |
90.79 |
9.21 |
0.0094 |
|
Lobular |
10.69 |
94.00 |
6.00 |
|
|
Other |
6.02 |
87.25 |
12.75 |
|
Tumor Size (mm) |
|
21.98 (19.93) |
21.37 (19.42) |
28.34 (23.80) |
<.0001 |
Number of positive nodes examined |
|
1.14 (2.97) |
1.07 (2.88) |
1.77 (3.77) |
0.0004 |
Total number of nodes examined |
|
6.11 (7.36) |
5.97 (7.28) |
7.50 (8.06) |
0.0004 |
Table2 Tumor characteristics, treatment, and relation with race (N = 4,220)
* row % or mean (std. dev.)
Variable |
|
Estimate |
Std. Err. |
p-value |
Hazard Ratio |
Triple Negative |
Triple negative vs Non-triple negative |
1.47 |
0.32 |
<.0001 |
4.34 |
|
Unknown vs Non-triple negative |
0.86 |
0.13 |
<.0001 |
2.35 |
Comorbidity |
|
0.47 |
0.13 |
0.0003 |
1.59* |
Race |
Black vs Non-Black |
0.46 |
0.16 |
0.0030 |
1.59 |
Diagnosis stage |
Distant vs Localized stage |
4.93 |
0.98 |
<.0001 |
138.95* |
|
Regional vs Localized stage |
1.08 |
0.20 |
<.0001 |
2.96 |
|
Unknown vs Localized stage |
1.70 |
0.25 |
<.0001 |
5.46 |
Tumor grade |
Moderately- vs Well-differentiated |
0.61 |
0.32 |
0.0532 |
1.85 |
|
Poorly-/un- vs Well-differentiated |
0.91 |
0.31 |
0.0034 |
2.49 |
Tumor size (mm) |
|
0.01 |
0.00 |
<.0001 |
1.01 |
Number of + nodes |
|
0.10 |
0.02 |
<.0001 |
1.10 |
Number of nodes |
|
-0.22 |
0.08 |
0.0054 |
0.81* |
Breast surgery |
Mastectomy vs No surgery |
0.06 |
0.32 |
0.8539 |
1.06 |
|
Other surgery vs No surgery |
-0.27 |
0.34 |
0.4333 |
0.77 |
|
Unknown vs No surgery |
0.49 |
0.30 |
0.1041 |
1.64 |
Insurance |
No insurance vs Other insurance |
0.49 |
0.26 |
0.0619 |
1.63 |
|
Medicaid vs Other insurance |
0.34 |
0.19 |
0.0729 |
1.41 |
|
Medicare vs Other insurance |
0.50 |
0.14 |
0.0004 |
1.66 |
Marital status |
Unmarried vs Married |
0.32 |
0.13 |
0.0150 |
1.37 |
|
Unknown vs Married |
-0.80 |
0.60 |
0.1800 |
0.45 |
Interactions with time |
|
|
|
|
|
Comorbidity x ln(time) |
-0.06 |
0.02 |
0.0051 |
|
|
Distant stage x ln(time) |
-0.41 |
0.16 |
0.0095 |
|
|
Number of nodes x ln(time) |
0.03 |
0.01 |
0.0288 |
|
|
Table3 multivariate survival analysis of time to breast cancer death (N = 4,124)
* HR at day 1 after diagnosis