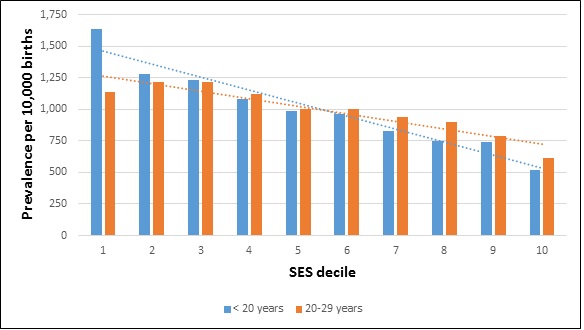
Figure 1 Socio-economic comparison of nulliparous teenage and 20-29 year old mothers
Figure 1 Socio-economic comparison of nulliparous teenage and 20-29 year old mothers
SES decile |
< 20 years |
20-29 years |
30-39 years |
>40 years |
Total |
1 |
1,321 |
8,479 |
6,328 |
378 |
16,506 |
2 |
1,037 |
9,097 |
6,848 |
393 |
17,375 |
3 |
995 |
9,097 |
7,025 |
389 |
17,506 |
4 |
872 |
8,390 |
6,996 |
365 |
16,623 |
5 |
795 |
7,486 |
7,060 |
391 |
16,146 |
6 |
781 |
7,486 |
7,128 |
449 |
15,844 |
7 |
667 |
6,996 |
7,086 |
431 |
15,180 |
8 |
604 |
6,695 |
6,697 |
411 |
14,677 |
9 |
596 |
5,907 |
6,738 |
452 |
13,693 |
10 |
420 |
4,556 |
6,084 |
481 |
11,541 |
Total |
8,088 |
74,603 |
68,260 |
4,140 |
155,091 |
Table1 Maternal age at the birth of the first child by SES
SES |
30-39 years |
<20 years |
20-29 years |
>40 years |
||
1 |
.... |
1.91(1.73, 2.09)*** |
1.28(1.22, 1.34)*** |
0.95(0.82, 1.09) |
||
2 |
.... |
1.38(1.25, 1.52)*** |
1.26(1.21, 1.32)*** |
0.91(0.79, 1.05) |
||
3 |
.... |
1.29(1.17, 1.43)*** |
1.23(1.18, 1.29)*** |
0.88(0.76, 1.01) |
||
4 |
.... |
1.14(1.03, 1.26) |
1.14(1.09, 1.19)*** |
0.83(0.72, 0.95) |
||
5 |
.... |
1.03(0.93, 1.14) |
1.07(1.02, 1.12) |
0.88(0.76, 1.01) |
||
6 |
Comparator group |
|||||
7 |
.... |
0.86(0.77, 0.96) |
0.94(0.90, 0.98)** |
0.97(0.84, 1.11) |
||
8 |
.... |
0.79(0.71, 0.88)*** |
0.92(0.87, 0.96)*** |
0.94(0.82, 1.07) |
||
9 |
.... |
0.81(0.72, 0.90)*** |
0.83(0.80, 0.88)*** |
1.06(0.93, 1.22) |
||
10 |
.... |
0.63(0.56, 0.71)*** |
0.71(0.68, 0.75)*** |
1.26(1.10, 1.43)** |
||
Table2 Odds ratios of maternal age by SES
SES, socio-economic status; **, P-value<0.005; ***, P-value<0.0005
SES |
20-29 years |
<20 years |
|||
1 |
.... |
1.49(1.36, 1.64)*** |
|||
2 |
.... |
1.09(0.99, 1.20) |
|||
3 |
.... |
1.05(0.95, 1.16) |
|||
4 |
.... |
1.00(0.90, 1.10) |
|||
5 |
.... |
<
0.96(0.87, 1.07) |
|||
6 |
Comparator group |
||||
7 |
.... |
0.91(0.82, 1.02) |
|||
8 |
.... |
0.86(0.77, 0.97) |
|||
9 |
.... |
0.97(0.86, 1.08) |
|||
10 |
.... |
0.88(0.78, 1.00) |
|||
Table3 A comparison of teenage mothers to 20-29 year old mothers
SES, socio-economic status; ***, P-value<0.0005.