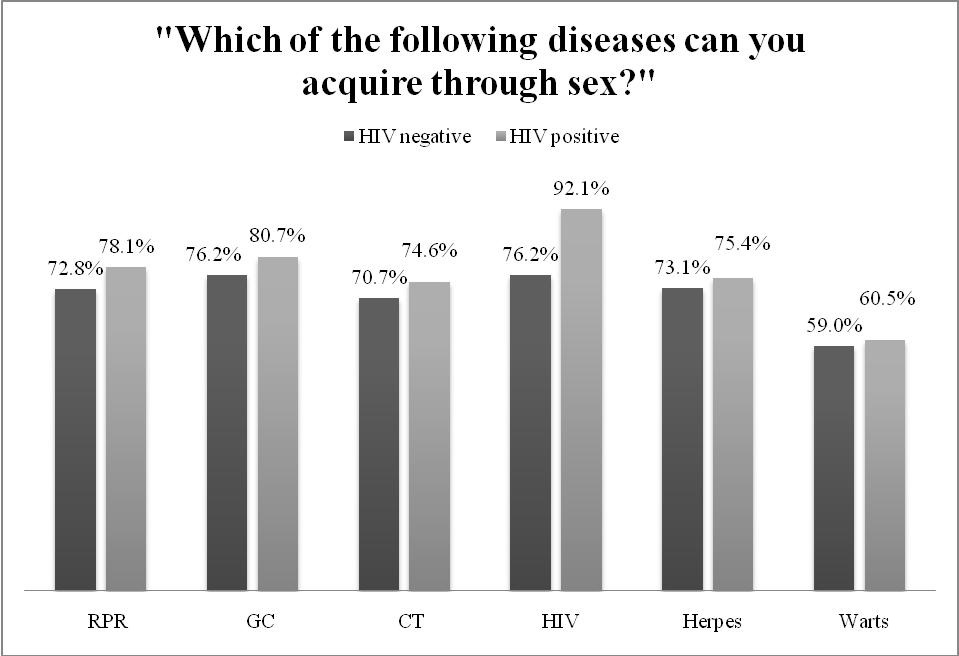
Figure 1
Figure 1
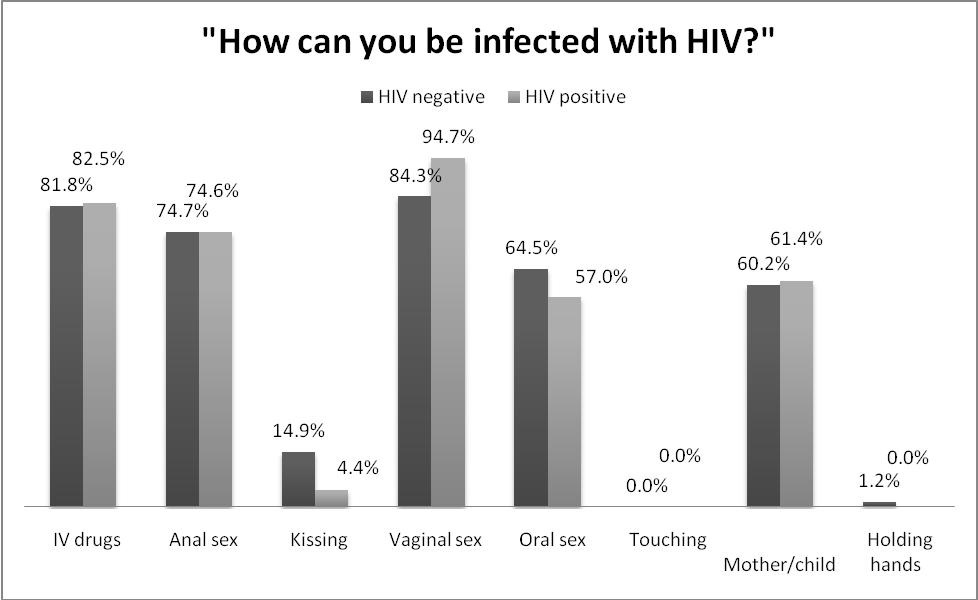
Figure 2
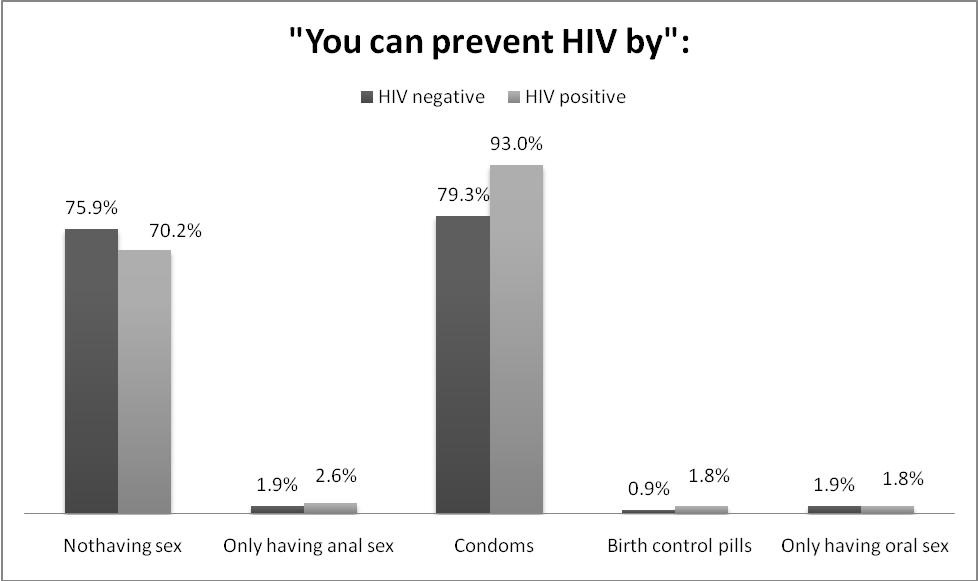
Figure 3
|
HIV negative |
HIV positive |
p value |
|
|
N = 324 |
N = 114 |
<0.05 |
|
|
|
|
|
|
Age |
39.1±15.1 |
41.3±12.6 |
0.089 |
|
Race |
|
|
0.359 |
|
Hispanic |
10(3.1) |
1(0.9) |
|
|
Black |
279(86.1) |
106(93.0) |
|
|
White |
13(4.0) |
1(0.9) |
|
|
Asian |
2(0.6) |
1(0.9) |
|
|
Native American |
1(0.3) |
0(0.0) |
|
|
Other/multiple |
19(5.9) |
5(4.4) |
|
|
Marital Status |
|
|
0.457 |
|
Married, living together |
59(18.2) |
12(10.6) |
|
|
Married, separated |
15(4.6) |
5(4.4) |
|
|
Divorced |
23(7.1) |
8(7.1) |
|
|
Widowed |
16(4.9) |
3(2.7) |
|
|
Living with boyfriend or partner |
40(12.4) |
14(12.4) |
|
|
Single |
167(51.5) |
70(62.0) |
|
|
Other |
4(1.2) |
1(0.9) |
|
|
Education |
|
|
0.043 |
|
11th grade or less |
39(12.1) |
21(18.8) |
|
|
High School graduate/GED |
118(36.5) |
49(43.8) |
|
|
Some college |
108(33.4) |
31(27.7) |
|
|
Completed 4 year college |
58(18.0) |
11(9.8) |
|
|
degree or more |
|
|
||
|
|
|
|
|
Income |
|
|
0.034 |
|
$0 - $19,999 |
132(42.6) |
63(55.8) |
|
|
$20,000 - $29,999 |
57(18.4) |
18(15.9) |
|
|
$30,000 -$54,999 |
70(22.6) |
24(21.2) |
|
|
$55,000 or more |
51(16.5) |
8(7.1) |
|
|
Main course of financial support |
|
|
0.150 |
|
Own job or Salary |
122(38.4) |
34(30.4) |
|
|
Public assistance |
103(32.4) |
49(43.8) |
|
|
Someone else’s job |
28(8.8) |
10(8.9) |
|
|
Multiple source |
26(8.2) |
11(9.8) |
|
|
Other |
39(12.3) |
8(7.1) |
|
|
Number of pregnancies |
3.1±2.5 |
4.0±2.9 |
0.002 |
|
Number of unplanned pregnancies |
0.8±1.4 |
1.1±1.7 |
0.175 |
|
Living Children |
1.7±1.6 |
2.3±1.9 |
0.009 |
|
Number of Abortions |
0.7±1.3 |
0.8±1.3 |
0.986 |
|
Number of Miscarriages |
0.4±0.9 |
0.6±1.2 |
0.260 |
|
Number of Ectopic Pregnancies |
0.1±0.2 |
0.1±0.3 |
0.261 |
|
Age first vaginal sex |
16.5±3.2 |
16.0±4.0 |
0.031 |
|
Number of partners |
5.8±7.4 |
7.6±9.1 |
0.017 |
|
Table1 Demographics for Survey Participants
|
HIV Negative |
HIV positive |
p value |
||
|
<0.05 |
|
|
||
|
|
|
|
|
|
Autocracy |
|
|
|
|
|
“I don’t want to have a baby.” |
60(18.5) |
34(29.8) |
0.0114 |
|
|
Bargaining |
|
|
|
|
|
“But we could get pregnant.” |
70(21.6) |
30(26.3) |
0.3027 |
|
|
“We need to use a condom to be safe.”
|
105(32.4)
|
69(60.5)
|
<0.0001
|
|
|
|
|||||
|
|||||
Bullying |
|
|
|
|
|
“Here is a condom.” |
84(25.9) |
51(44.7) |
0.0002 |
|
|
Just put a condom on him without saying anything.
|
20(6.2)
|
32(28.1)
|
0.0004
|
|
|
|
|
||||
|
|
||||
Disengagement |
|
|
|
|
|
“I will not have sex without a condom.”
|
89(27.5)
|
52(45.6)
|
0.0004
|
|
|
|
|
||||
|
|
||||
Manipulation |
|
|
|
|
|
“I have a STD.” |
14(4.3) |
12(10.5) |
0.0159 |
|
|
Supplication |
|
|
|
|
|
“Do you have a condom?” |
82(25.3) |
52(45.6) |
<0.0001 |
|
|
Table2 Negotiation Tactics of Survey Participants