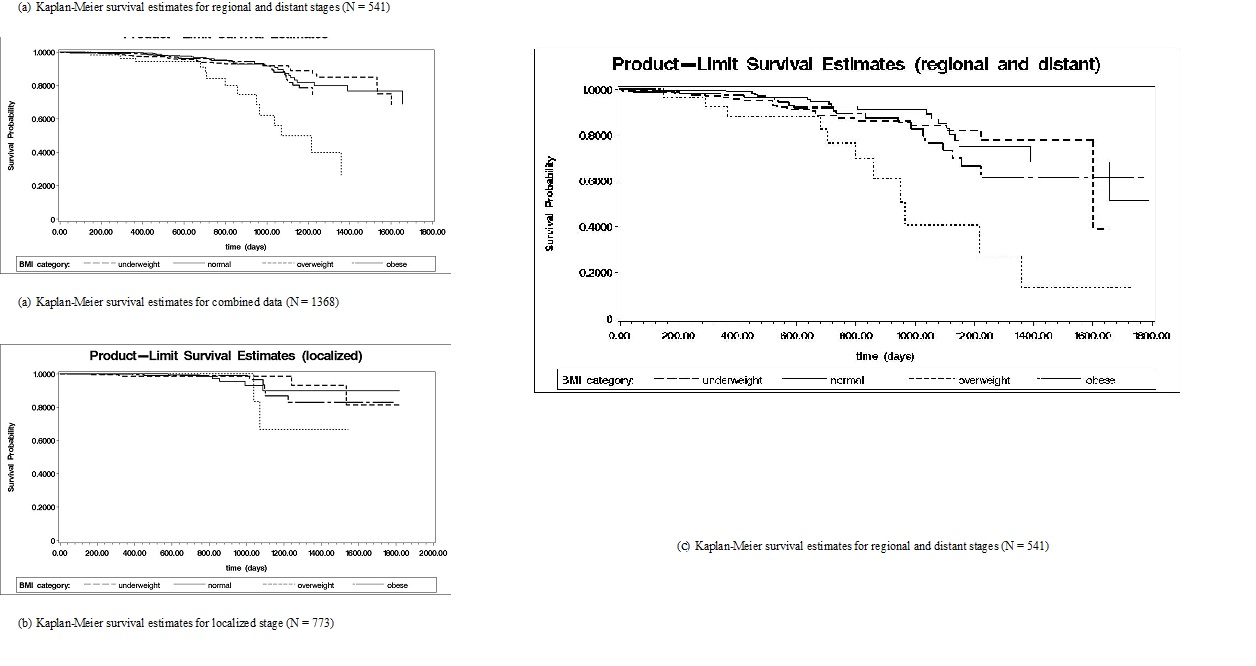
Figure 1 Kaplan-Meier survival estimates by BMI category
Figure 1 Kaplan-Meier survival estimates by BMI category
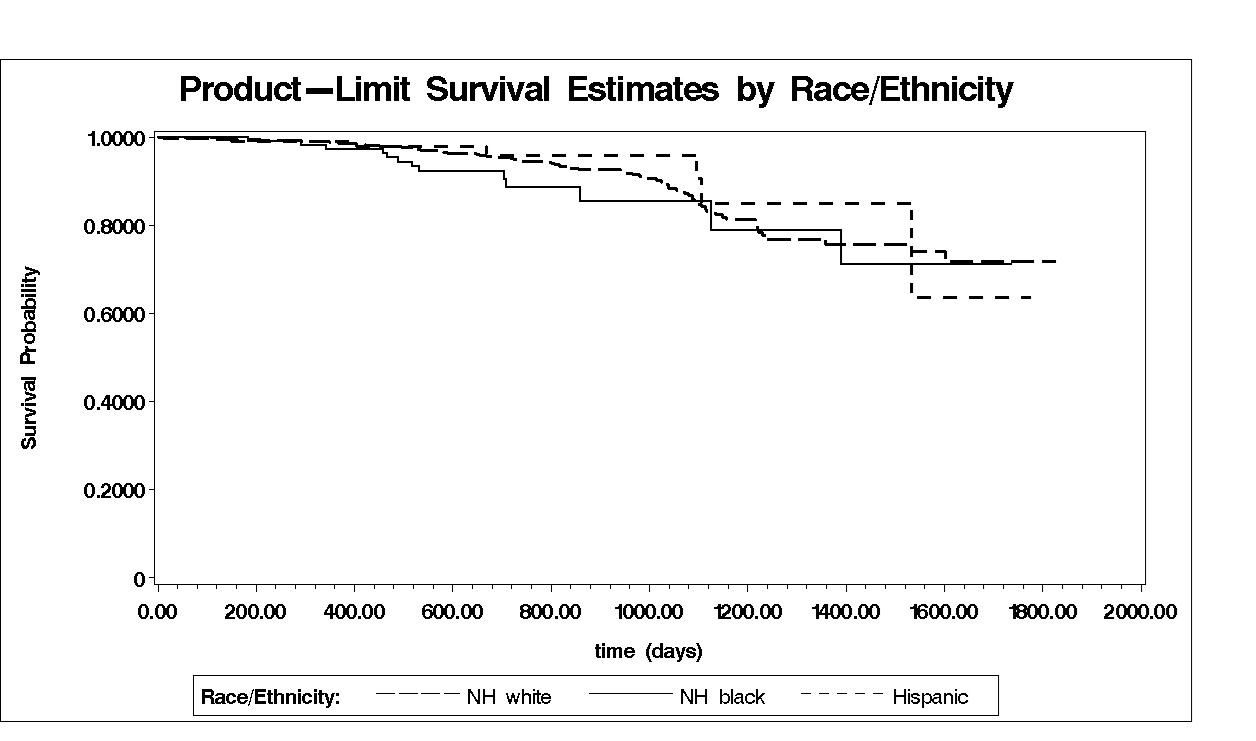
Figure 2 Kaplan-Meier Survival Estimate by Race/Ethnicity (N = 1323)
Variable |
|
Percentage |
Non-underweight* |
Underweight* |
P-Value |
BMI |
Under weight |
4.02 |
|
|
|
|
Normal |
33.04 |
|
|
|
|
Overweight |
29.68 |
|
|
|
|
Obese I |
18.20 |
|
|
|
|
Obese II |
8.99 |
|
|
|
|
Obese III |
6.07 |
|
|
|
Age at dx |
Age at dx <= 50 |
25.66 |
25.29 |
34.55 |
0.1546 |
|
Age at dx > 50 |
74.34 |
74.71 |
65.45 |
|
Race/Ethnicity |
NH white |
83.67 |
83.62 |
84.91 |
0.6570 |
|
NH black |
8.77 |
8.90 |
5.66 |
|
|
Hispanic |
7.56 |
7.48 |
9.43 |
|
Social economic status** |
SEG 1 |
13.60 |
13.33 |
20.00 |
0.2308 |
|
SEG 2 |
33.48 |
33.59 |
30.91 |
|
|
SEG 3 |
30.34 |
30.77 |
20.00 |
|
|
SEG 4 |
20.83 |
20.64 |
25.45 |
|
|
Unknown |
1.75 |
1.68 |
3.64 |
|
Married |
Single |
45.32 |
45.16 |
49.09 |
0.8385 |
|
Married |
51.17 |
51.33 |
47.27 |
|
|
Unknown |
3.51 |
3.50 |
3.64 |
|
Insurance |
Not insured |
3.00 |
2.89 |
5.45 |
0.6711 |
|
Medicaid |
8.11 |
8.00 |
10.91 |
|
|
Medicare |
32.68 |
32.75 |
30.91 |
|
|
Private insurance |
53.80 |
54.00 |
49.09 |
|
|
Unknown |
2.41 |
2.36 |
3.64 |
|
Total comorbidity |
|
0.65 (1.29) |
0.65 (1.31) |
0.49 (0.96) |
0.2330 |
Table1 Patient characteristics and relation with underweight (N = 1,368)
* column % or mean (std. dev.) ** SEG 1 = “> 20% living in poverty”, SEG 2 = “Between 10% and <20% of population living in poverty”, SEG 3 = “Between 5% and <10% of population living in poverty”, SEG 4 = “< 5% of population living in poverty”
Variable |
|
Percentage |
Non-underweight* |
Underweight* |
P-Value |
ER |
- |
18.64 |
18.20 |
29.09 |
0.1151 |
|
+ |
76.54 |
77.00 |
65.45 |
|
|
Unknown |
4.82 |
4.80 |
5.45 |
|
PR |
- |
32.75 |
32.29 |
43.64 |
0.2006 |
|
+ |
61.99 |
62.45 |
50.91 |
|
|
Unknown |
5.26 |
5.26 |
5.45 |
|
HER2 |
- |
42.91 |
42.80 |
45.45 |
0.6140 |
|
+ |
11.40 |
11.58 |
7.27 |
|
|
Unknown |
45.69 |
45.62 |
47.27 |
|
Triple Negative |
No |
79.61 |
79.97 |
70.91 |
0.1168 |
|
Yes |
6.29 |
6.32 |
5.45 |
|
|
Unknown |
14.11 |
13.71 |
23.64 |
|
Breast surgery |
No surgery |
2.19 |
2.13 |
3.64 |
0.0772 |
|
Mastectomy |
40.13 |
39.98 |
43.64 |
|
|
Other surgery |
49.20 |
49.73 |
36.36 |
|
|
Unknown |
8.48 |
8.15 |
16.36 |
|
Hormone |
No |
74.34 |
74.26 |
76.36 |
0.5362 |
|
Yes |
23.54 |
23.53 |
23.64 |
|
|
Unknown |
2.12 |
2.21 |
0.00 |
|
Radiation |
No |
66.59 |
66.49 |
69.09 |
0.2464 |
|
Yes |
32.97 |
33.13 |
29.09 |
|
|
Unknown |
0.44 |
0.38 |
1.82 |
|
Chemo |
No |
54.02 |
53.92 |
56.36 |
0.8750 |
|
Yes |
41.30 |
41.43 |
38.18 |
|
|
Unknown |
4.68 |
4.65 |
5.45 |
|
Stage |
Localized |
56.51 |
56.97 |
45.45 |
0.0007 |
|
Regional |
33.77 |
33.89 |
30.91 |
|
|
Distant |
5.77 |
5.26 |
18.18 |
|
|
Unknown/unstaged |
3.95 |
3.88 |
5.45 |
|
Grade |
Well-differentiated |
19.08 |
19.27 |
14.55 |
0.1262 |
|
Moderately-differentiated |
37.87 |
38.23 |
29.09 |
|
|
Poorly- or un-differentiated |
43.06 |
42.50 |
56.36 |
|
Histology |
Ductal |
83.77 |
83.93 |
80.00 |
0.4992 |
|
Lobular |
10.67 |
10.66 |
10.91 |
|
|
Other |
5.56 |
5.41 |
9.09 |
|
Tumor Size (mm) |
|
24.40 (22.62) |
24.24 (22.45) |
28.05 (26.35) |
0.2210 |
Number of positive nodes examined |
|
1.29 (2.98) |
1.27 (2.95) |
1.95 (3.63) |
0.1775 |
Total number of nodes examined |
|
6.88 (7.90) |
6.97 (7.94) |
4.65 (6.48) |
0.0329 |
Table2 Tumor characteristics and treatment, and relation with underweight (N = 1,368)
* column % or mean (std. dev.)
Variable |
|
Hazard Ratio |
95% CI |
P-Value |
|
BMI (vs. Normal weight) |
Underweight |
2.612 |
1.200 |
5.685 |
0.0156 |
|
Overweight |
1.130 |
0.638 |
2.004 |
0.6752 |
|
Obese |
1.710 |
0.965 |
3.030 |
0.0660 |
Age at dx (vs. <= 50) |
Age at dx > 50 |
0.713 |
0.418 |
1.217 |
0.2152 |
Race/Ethnicity(vs. NH white) |
NH black |
1.272 |
0.598 |
2.704 |
0.5317 |
|
Hispanic |
0.678 |
0.260 |
1.767 |
0.4260 |
Social economic status (vs. SEG 4)* |
SEG 1 |
0.574 |
0.258 |
1.280 |
0.1753 |
|
SEG 2 |
0.592 |
0.310 |
1.131 |
0.1124 |
|
SEG 3 |
0.902 |
0.497 |
1.637 |
0.7346 |
|
Unknown |
0.370 |
0.062 |
2.221 |
0.2770 |
Married (vs. Married) |
Single |
1.071 |
0.670 |
1.711 |
0.7749 |
|
Unknown |
0.628 |
0.139 |
2.843 |
0.5462 |
Insurance (vs. Private insurance) |
Not insured |
2.246 |
0.814 |
6.198 |
0.1181 |
|
Medicaid |
1.766 |
0.930 |
3.354 |
0.0821 |
|
Medicare |
2.422 |
1.394 |
4.208 |
0.0017 |
Total comorbidity |
|
0.914 |
0.791 |
1.056 |
0.2206 |
Triple Negative (vs. Non-Triple Negative) |
Triple Negative |
8.514 |
3.940 |
18.400 |
<.0001 |
|
Unknown |
4.501 |
2.663 |
7.607 |
<.0001 |
Breast surgery (vs. No surgery) |
Mastectomy |
2.848 |
0.899 |
9.016 |
0.0751 |
|
Other surgery |
3.398 |
0.997 |
11.582 |
0.0505 |
|
Unknown |
4.768 |
1.588 |
14.316 |
0.0054 |
Hormone (vs. No-Hormone) |
Hormone |
1.205 |
0.603 |
2.410 |
0.5976 |
|
Unknown |
1.572 |
0.135 |
18.335 |
0.7181 |
Radiation (vs. No-Radiation) |
Radiation |
1.407 |
0.830 |
2.384 |
0.2043 |
|
Unknown |
2.895 |
0.461 |
18.175 |
0.2567 |
Chemo(vs. No-Chemo) |
Chemo |
1.117 |
0.699 |
1.784 |
0.6446 |
|
Unknown |
0.999 |
0.233 |
4.283 |
0.9994 |
Stage (vs. Localized) |
Regional |
1.883 |
0.931 |
3.809 |
0.0783 |
|
Distant |
10.522 |
4.950 |
22.367 |
<.0001 |
|
Unknown /unstaged |
4.455 |
1.923 |
10.322 |
0.0005 |
Grade (vs. Well-differentiated) |
Moderately-differentiated |
3.318 |
0.761 |
14.470 |
0.1104 |
|
Poorly- or un-differentiated |
4.109 |
0.955 |
17.682 |
0.0577 |
Histology(vs. Ductal) |
Lobular |
1.299 |
0.659 |
2.561 |
0.4496 |
|
Other |
0.621 |
0.290 |
1.329 |
0.2201 |
Tumor Size (mm) |
|
1.015 |
1.008 |
1.022 |
<.0001 |
Number of positive nodes examined |
|
1.160 |
1.087 |
1.238 |
<.0001 |
Total number of nodes examined |
|
0.957 |
0.919 |
0.995 |
0.0281 |
Underweight x NH black |
|
0.425 |
|
|
0.3993 |
Underweight x Hispanic |
|
0.560 |
|
|
0.6320 |
Table3 multivariate survival analysis of time to breast cancer death (N = 1,292)
* SEG 1 = “> 20% living in poverty”, SEG 2 = “Between 10% and <20% of population living in poverty”, SEG 3 = “Between 5% and <10% of population living in poverty”, SEG 4 = “< 5% of population living in poverty”