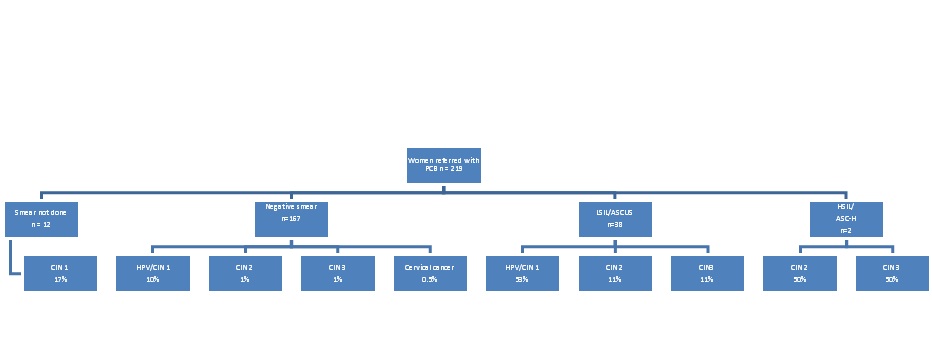
Figure 1 Flow chart of biopsy results for each type of smear referral
Figure 1 Flow chart of biopsy results for each type of smear referral
Smear Result |
Number of women |
% |
Negative for Squamous Lesion |
166 |
76% |
Low grade/ Atypical squamous cells of undetermined significance |
38 |
17% |
High grade/Atypical squamous cells favouring high grade |
2 |
1% |
Reactive |
1 |
<1% |
Not done |
12 |
5% |
Table 1 – Smear result at referral
Histology result |
Number of women |
% |
No biopsy taken, normal colposcopy |
122 |
74% |
Normal |
22 |
13% |
CIN 1 |
17 |
10% |
CIN 2 |
2 |
1.2% |
CIN 3 |
2 |
1.2% |
Cervical cancer |
1 |
0.6% |
Table 2 – Histology results in women with normal referral smear
Examination Finding |
n |
|
Normal |
43 |
20% |
Ectropion |
80 |
37% |
Polyp |
9 |
4% |
HPV/low grade changes |
67 |
31% |
High grade |
15 |
7% |
Malignancy |
1 |
0.50% |
Vaginal tear |
1 |
0.50% |
Cervical fibroid |
1 |
0.50% |
Inflammation |
12 |
5% |
Endocervical button post lletz |
6 |
3% |
Declined |
1 |
0.50% |
Table 3 – Colposcopic examination findings - all women referred
*Some patients had more than one examination finding so percentages do not add to 100.
Histology result |
n |
Proportion of women that had biopsy taken |
Proportion of all women referred with PCB |
No biopsy taken |
109 |
|
50% |
Normal |
36 |
33% |
15% |
Inflammation |
24 |
22% |
11% |
HPV/CIN1 |
29 |
26% |
13% |
CIN2 |
6 |
5% |
3% |
CIN3 |
5 |
5% |
2% |
Cancer - SCC |
1 |
<1% |
<1% |
Fibroid |
1 |
<1% |
<1% |
Insuffficient |
3 |
3% |
1.4% |
Benign polyp |
5 |
5% |
2% |
Table 4 – Histology results for women that had colposcopically guided biopsies
Treatment |
n |
|
Diathermy |
21 |
19% |
LLETZ |
14 |
13% |
Cone biopsy |
0 |
0 |
Follow up colposcopy |
18 |
16% |
Ultrasound gynae |
3 |
3% |
Silver nitrate |
11 |
10% |
Radical hysterectomy |
1 |
<1% |
Antibiotics |
1 |
<1% |
Hysteroscopy + D&C |
1 |
<1% |
PRINCESS† study |
1 |
<1% |
No treatment after biopsy |
38 |
35% |
Table 5 – Treatments offered after biopsy
†PRINCess: The Prediction of Regression in CIN2 – a multicentre trial.