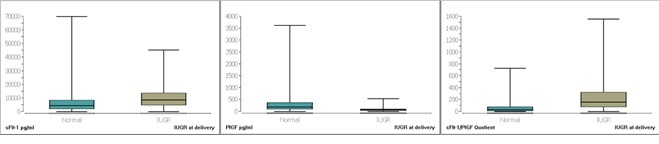
Figure 1 Box plot of sFlt-1, PlGF, and their ratio for patients who had IUGR-related delivery against isolated preeclampsia.
Figure 1 Box plot of sFlt-1, PlGF, and their ratio for patients who had IUGR-related delivery against isolated preeclampsia.
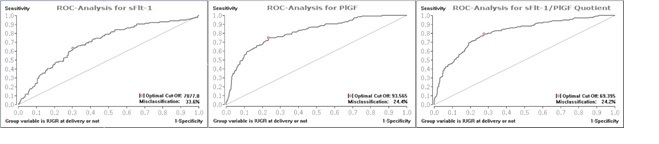
Figure 2 Roc curve analysis for sFlt-1, PlGF, and their ratio as a diagnostic value for predicting IUGR at delivery.
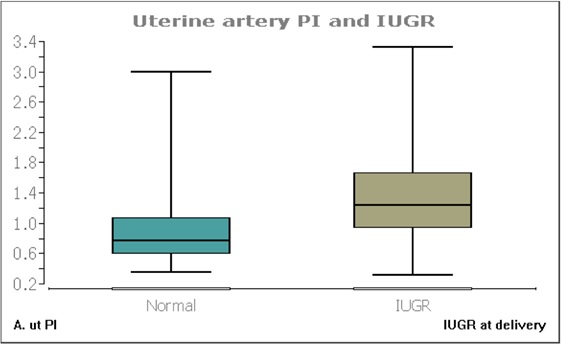
Figure 3 Box plot of the uterine artery PI for patients who eventually develop IUGR against those without.
|
IUGR related |
median |
min. |
max. |
n. |
r |
P |
sFlt-1 |
no |
4217 |
22.97 |
69761 |
441 |
0.29 |
0.69 |
yes |
8239 |
85 |
45017 |
136 |
|||
PlGF |
no |
177.5 |
7 |
3604 |
441 |
0.46 |
0.19 |
yes |
56.11 |
3 |
528 |
136 |
|||
Ratio |
no |
24.92 |
0.45 |
723.4 |
441 |
0.45 |
0.81 |
yes |
154.4 |
2.55 |
1551.3 |
136 |
Table 1. The results of the Wilcoxon-Mann-Whitney-U test for the angiogenesis factors and IUGR at delivery (min: minimum, max: maximum, n: number of patients, r: effect size, P: Mann-Whitney P value)
|
sFlt-1 |
PlGF |
Ratio |
|
Uterine artery PI |
ρ p |
0.14 <10-3 |
-0.43 <10-6 |
0.33 <10-6 |
Diabetes |
ρ p |
-0.07 0.06 |
-0.04 0.25 |
-0.03 0.47 |
Gestational age at delivery |
ρ p |
-0.32 <10-6 |
0.3 <10-6 |
-0.39 <10-6 |
5 minutes APGAR |
ρ p |
-0.15 <10-3 |
0.23 <10-6 |
-0.22 <10-6 |
Birth weight |
ρ p |
-0.37 <10-6 |
0.41 <10-6 |
-0.49 <10-6 |
Table 2. The results of Spearman's correlation between the angiogenesis factors and Doppler results, diabetes and other delivery variables (ρ = Spearman's correlation Rho, p = value for statistical significance)
Uterine artery PI |
median |
Range |
1. quartile |
3. quartile |
Normal |
0.77 |
0.37-2.99 |
0.6 |
1.07 |
IUGR |
1.23 |
0.33-3.33 |
0.94 |
1.66 |
Table 3. Comparison of the uterine artery PI values in patients who develop IUGR and normal patients