Data type |
School |
Total (n=300) |
Medical(n=150) |
Literature(n=150) |
No |
% |
No |
% |
No |
% |
Socio demographic data
Age in years |
|
|
|
|
|
|
|
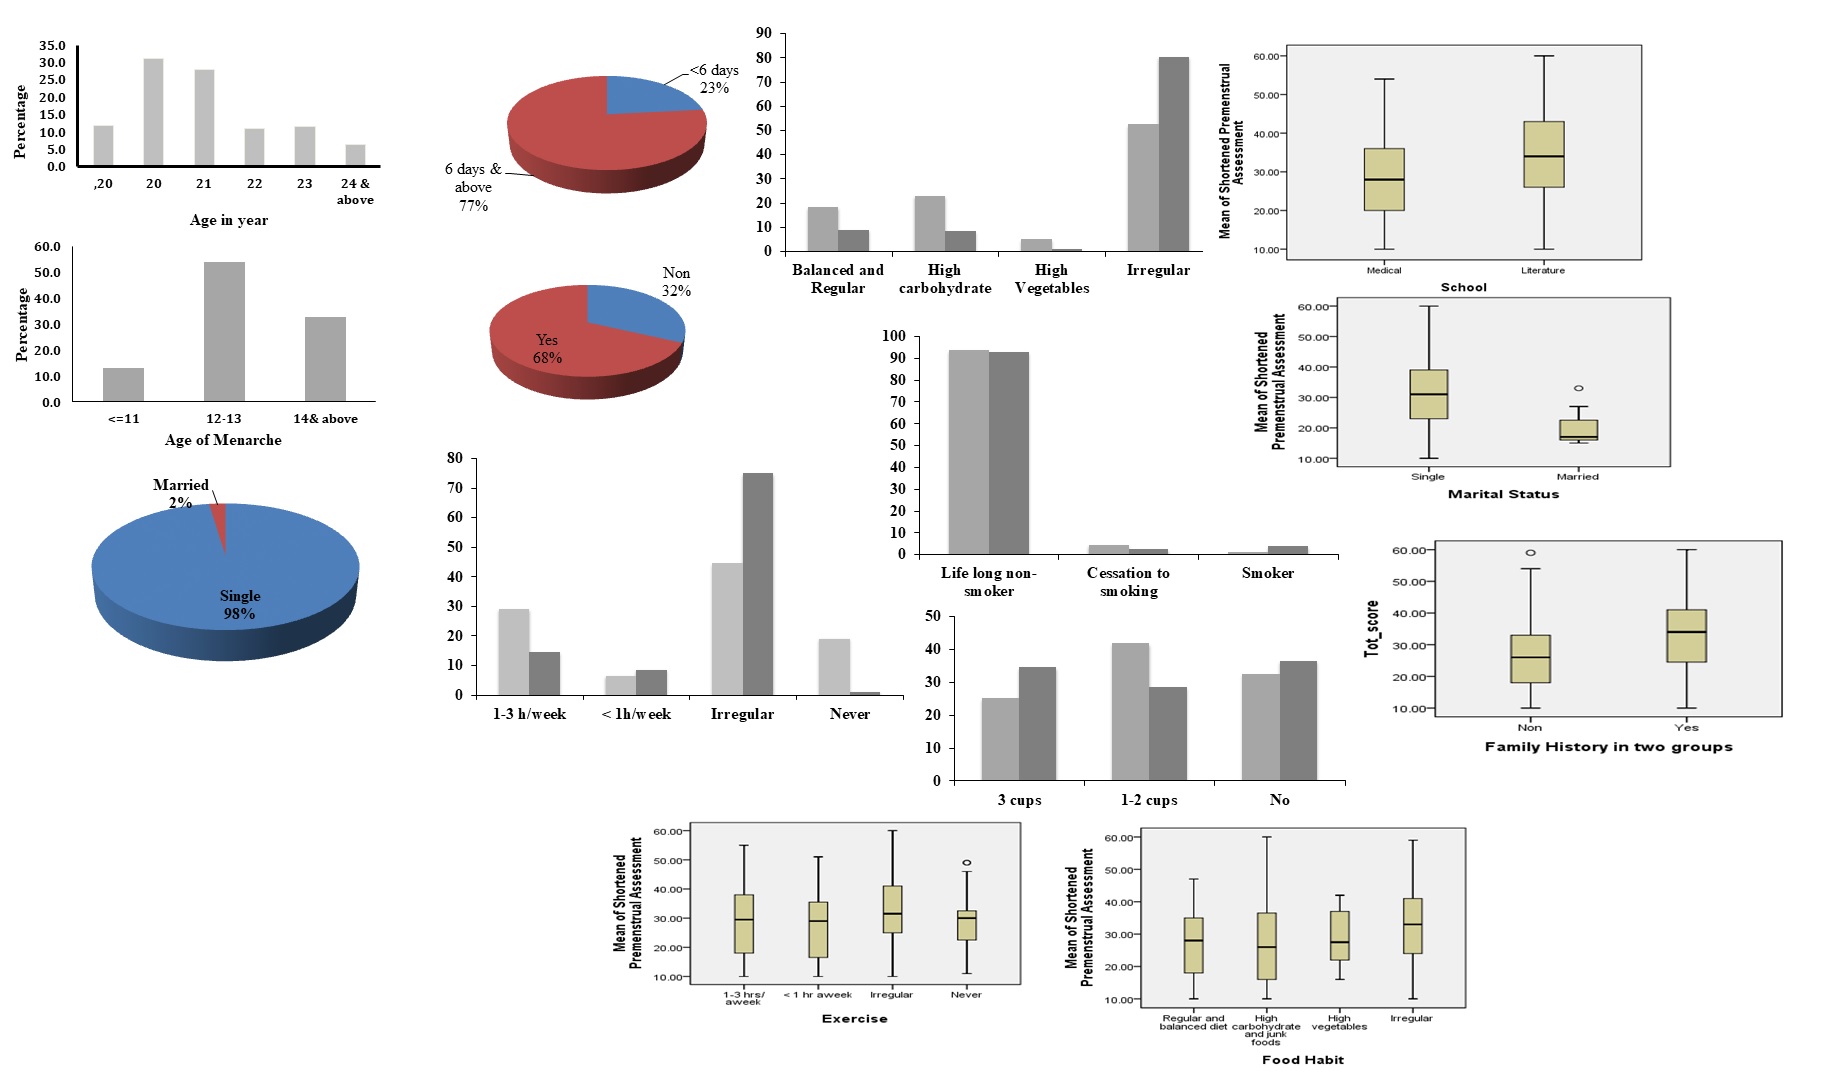
<20 |
12 |
8.0 |
24 |
16.0 |
36 |
12.0 |
|
20 |
55 |
36.7 |
38 |
25.3 |
93 |
31.0 |
|
21 |
42 |
28.0 |
42 |
28.0 |
84 |
28.0 |
|
22 |
11 |
7.3 |
22 |
14.7 |
33 |
11.0 |
|
23 |
19 |
12.7 |
16 |
10.7 |
35 |
11.7 |
|
24 & above |
11 |
7.3 |
8 |
5.3 |
19 |
6.3 |
|
Mean±SD |
21.1±1.9 |
21.0±1.5 |
21.5±1.7 |
|
Median |
21 |
21 |
21 |
|
Min/Max |
19/35 |
18/26 |
18/35 |
|
|
|
|
|
|
|
|
Age of Menarche |
|
|
|
|
|
|
|
<=11 |
24 |
16.0 |
15 |
10.0 |
39 |
13.0 |
|
12-13 |
83 |
55.3 |
79 |
52.7 |
162 |
54.0 |
|
14& above |
43 |
|
56 |
37.3 |
99 |
33.0 |
|
Mean±SD |
12.8±1.8 |
28.7 |
13.0±1.6 |
12.9±1.7 |
|
Median |
13 |
13 |
13 |
|
Min/Max |
7/22 |
7/17 |
7/22 |
|
|
|
|
|
|
|
|
Marital Status |
|
|
|
|
|
|
|
Single |
146 |
97.3 |
147 |
98.0 |
293 |
97.7 |
|
Married |
4 |
2.7 |
3 |
2.0 |
7 |
2.3 |
|
|
|
|
|
|
|
|
BMI (n=229) |
|
|
|
|
|
|
|
<18.5 |
15 |
12.5 |
14 |
12.8 |
29 |
12.7 |
|
18.5-24.9 |
71 |
59.2 |
57 |
52.3 |
128 |
55.9 |
|
25-<30 |
23 |
19.2 |
10 |
9.2 |
33 |
14.4 |
|
30& Above |
11 |
9.2 |
28 |
25.7 |
39 |
17.0 |
Reproductive data
Duration of menstruation |
|
|
|
|
|
|
|
<6 days |
36 |
24.0 |
34 |
22.7 |
70 |
23.3 |
|
6 days & above |
114 |
76.0 |
116 |
77.3 |
230 |
76.7 |
|
|
|
|
|
|
|
|
Family history of PMS |
|
|
|
|
|
|
|
No |
63 |
42.0 |
33 |
22.0 |
96 |
32.0 |
|
Yes |
87 |
58.0 |
117 |
78.0 |
204 |
68.0 |
|
|
|
|
|
|
|
|
Family historybreak-up |
|
|
|
|
|
|
|
No |
63 |
42.0 |
33 |
22.0 |
96 |
32.0 |
|
Mother |
25 |
16.7 |
41 |
27.3 |
66 |
22.0 |
|
Sister |
50 |
33.3 |
49 |
32.7 |
99 |
33.0 |
|
Aunt |
5 |
3.3 |
12 |
8.0 |
17 |
5.7 |
|
Cousin |
6 |
4.0 |
6 |
4.0 |
12 |
4.0 |
|
Others |
1 |
0.7 |
9 |
6.0 |
10 |
3.3 |
Life style data
Exercise |
|
|
|
|
|
|
|
1-3 hrs/ a week |
44 |
29.3 |
22 |
14.7 |
66 |
22.0 |
|
< 1 hr a week |
10 |
6.7 |
13 |
8.7 |
23 |
7.7 |
|
Irregular |
67 |
44.7 |
113 |
75.3 |
180 |
60.0 |
|
Never |
29 |
19.3 |
2 |
1.3 |
31 |
10.3 |
|
|
|
|
|
|
|
|
Food Habit |
|
|
|
|
|
|
|
Regular and balanced diet |
28 |
18.7 |
14 |
9.3 |
42 |
14.0 |
|
High carbohydrate and junk foods |
35 |
23.3 |
13 |
8.7 |
48 |
16.0 |
|
High vegetables |
8 |
5.3 |
2 |
1.3 |
10 |
3.3 |
|
Irregular |
79 |
52.7 |
121 |
80.7 |
200 |
66.7 |
|
|
|
|
|
|
|
|
Smoking |
|
|
|
|
|
|
|
Life long non-smoker |
141 |
94.0 |
140 |
93.3 |
281 |
93.7 |
|
Cessation to smoking |
7 |
4.7 |
4 |
2.7 |
11 |
3.7 |
|
Smoker |
2 |
1.3 |
6 |
4.0 |
8 |
2.7 |
|
|
|
|
|
|
|
|
Caffeine |
|
|
|
|
|
|
|
3 cups or more |
38 |
25.3 |
52 |
34.7 |
90 |
30.0 |
|
1-2 cups |
63 |
42.0 |
43 |
28.7 |
106 |
35.3 |
|
No |
49 |
32.7 |
55 |
36.7 |
104 |
34.7 |
Table 1: Socio-demographic, reproductive and life style characteristics of study participants
Symptoms |
School |
Total (n=300) |
Medical(n=150) |
Literature(n=150) |
No |
% |
No |
% |
No |
% |
Pain |
|
|
|
|
|
|
|
1 |
32 |
21.3 |
44 |
29.3 |
76 |
25.3 |
|
2 |
33 |
22.0 |
23 |
15.3 |
56 |
18.7 |
|
3 |
38 |
25.3 |
25 |
16.7 |
63 |
21.0 |
|
4 |
23 |
15.3 |
20 |
13.3 |
43 |
14.3 |
|
5 |
18 |
12.0 |
21 |
14.0 |
39 |
13.0 |
|
6 |
6 |
4.0 |
17 |
11.3 |
23 |
7.7 |
|
|
|
|
|
|
|
|
Anxiety |
|
|
|
|
|
|
|
1 |
31 |
20.7 |
31 |
20.7 |
62 |
20.7 |
|
2 |
43 |
28.7 |
30 |
20.0 |
73 |
24.3 |
|
3 |
36 |
24.0 |
19 |
12.7 |
55 |
18.3 |
|
4 |
18 |
12.0 |
22 |
14.7 |
40 |
13.3 |
|
5 |
15 |
10.0 |
22 |
14.7 |
37 |
12.3 |
|
6 |
7 |
4.7 |
26 |
17.3 |
33 |
11.0 |
|
|
|
|
|
|
|
|
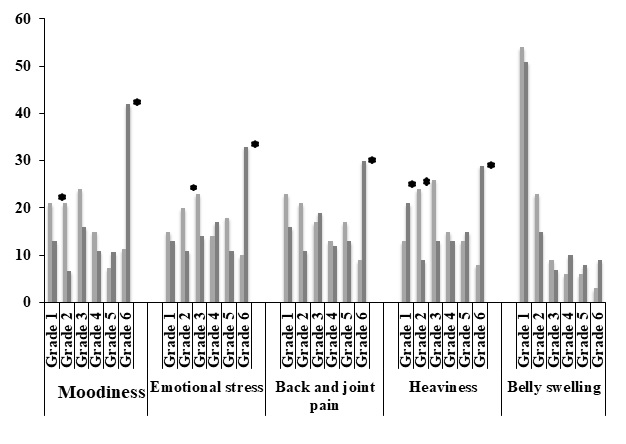
Emotional Stress |
|
|
|
|
|
|
|
1 |
23 |
15.3 |
20 |
13.3 |
43 |
14.3 |
|
2 |
30 |
20.0 |
17 |
11.3 |
47 |
15.7 |
|
3 |
34 |
22.7 |
21 |
14.0 |
55 |
18.3 |
|
4 |
21 |
14.0 |
25 |
16.7 |
46 |
15.3 |
|
5 |
27 |
18.0 |
17 |
11.3 |
44 |
14.7 |
|
6 |
15 |
10.0 |
50 |
33.3 |
65 |
21.7 |
|
|
|
|
|
|
|
|
Moodiness |
|
|
|
|
|
|
|
|
1 |
31 |
20.7 |
20 |
13.3 |
51 |
17.0 |
|
2 |
32 |
21.3 |
10 |
6.7 |
42 |
14.0 |
|
3 |
36 |
24.0 |
24 |
16.0 |
60 |
20.0 |
|
4 |
23 |
15.3 |
17 |
11.3 |
40 |
13.3 |
|
5 |
11 |
7.3 |
16 |
10.7 |
27 |
9.0 |
6 |
17 |
11.3 |
63 |
42.0 |
80 |
26.7 |
|
|
|
|
|
|
|
|
Sadness |
|
|
|
|
|
|
|
|
1 |
22 |
14.7 |
35 |
23.3 |
57 |
19.0 |
|
2 |
32 |
21.3 |
19 |
12.7 |
51 |
17.0 |
|
3 |
32 |
21.3 |
21 |
14.0 |
53 |
17.7 |
|
4 |
33 |
22.0 |
19 |
12.7 |
52 |
17.3 |
|
5 |
13 |
8.7 |
21 |
14.0 |
34 |
11.3 |
|
6 |
18 |
12.0 |
35 |
23.3 |
53 |
17.7 |
Back and Joint Pain |
|
|
|
|
|
|
|
1 |
35 |
23.3 |
24 |
16.0 |
59 |
19.7 |
|
2 |
32 |
21.3 |
16 |
10.7 |
48 |
16.0 |
|
3 |
26 |
17.3 |
28 |
18.7 |
54 |
18.0 |
|
4 |
19 |
12.7 |
18 |
12.0 |
37 |
12.3 |
5 |
25 |
16.7 |
19 |
12.7 |
44 |
14.7 |
|
6 |
13 |
8.7 |
45 |
30.0 |
58 |
19.3 |
Weight Gain |
|
|
|
|
|
|
|
1 |
64 |
42.7 |
91 |
60.7 |
155 |
51.7 |
|
2 |
32 |
21.3 |
21 |
14.0 |
53 |
17.7 |
|
3 |
26 |
17.3 |
13 |
8.7 |
39 |
13.0 |
|
4 |
19 |
12.7 |
14 |
9.3 |
33 |
11.0 |
|
5 |
6 |
4.0 |
5 |
3.3 |
11 |
3.7 |
|
6 |
3 |
2.0 |
6 |
4.0 |
9 |
3.0 |
|
|
|
|
|
|
|
|
Heaviness |
|
|
|
|
|
|
|
1 |
20 |
13.3 |
31 |
20.7 |
51 |
17.0 |
|
2 |
36 |
24.0 |
13 |
8.7 |
49 |
16.3 |
3 |
39 |
26.0 |
19 |
12.7 |
58 |
19.3 |
|
4 |
23 |
15.3 |
20 |
13.3 |
43 |
14.3 |
|
5 |
20 |
13.3 |
23 |
15.3 |
43 |
14.3 |
|
6 |
12 |
8.0 |
44 |
29.3 |
56 |
18.7 |
|
|
|
|
|
|
|
|
Swelling |
|
|
|
|
|
|
|
1 |
81 |
54.0 |
77 |
51.3 |
158 |
52.7 |
|
2 |
34 |
22.7 |
22 |
14.7 |
56 |
18.7 |
|
3 |
13 |
8.7 |
10 |
6.7 |
23 |
7.7 |
|
4 |
9 |
6.0 |
15 |
10.0 |
24 |
8.0 |
|
5 |
9 |
6.0 |
12 |
8.0 |
21 |
7.0 |
|
6 |
4 |
2.7 |
14 |
9.3 |
18 |
6.0 |
|
|
|
|
|
|
|
|
Belly Swelling |
|
|
|
|
|
|
|
1 |
41 |
27.3 |
42 |
28.0 |
83 |
27.7 |
|
2 |
26 |
17.3 |
13 |
8.7 |
39 |
13.0 |
|
3 |
37 |
24.7 |
15 |
10.0 |
52 |
17.3 |
|
4 |
20 |
13.3 |
26 |
17.3 |
46 |
15.3 |
|
5 |
15 |
10.0 |
18 |
12.0 |
33 |
11.0 |
|
6 |
11 |
7.3 |
36 |
24.0 |
47 |
15.7 |
Table 2: Qualitative assessment of the severity of premenstrual symptoms
|
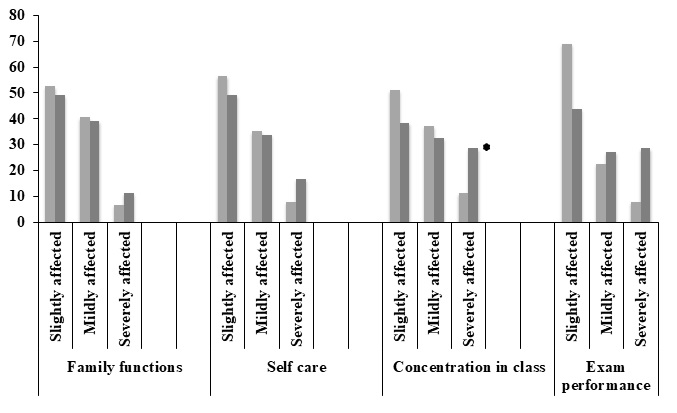
Functions |
School |
Total (n=300) |
Medical(n=150) |
Literature(n=150) |
No |
% |
No |
% |
No |
% |
Family Function |
|
|
|
|
|
|
|
Unaffected / Slightly affected |
79 |
52.7 |
74 |
49.3 |
153 |
51.0 |
|
Moderately affected |
61 |
40.7 |
59 |
39.3 |
120 |
40.0 |
|
Significantly/Seriously affected |
10 |
6.7 |
17 |
11.3 |
27 |
9.0 |
|
|
|
|
|
|
|
|
Self-Care |
|
|
|
|
|
|
|
Unaffected / Slightly affected |
85 |
56.7 |
74 |
49.3 |
159 |
53.0 |
|
Moderately affected |
53 |
35.3 |
51 |
34.0 |
104 |
34.7 |
|
Significantly/Seriously affected |
12 |
8.0 |
25 |
16.7 |
37 |
12.3 |
|
|
|
|
|
|
|
|
Concentration in class |
|
|
|
|
|
|
|
Unaffected / Slightly affected |
77 |
51.3 |
58 |
38.7 |
135 |
45.0 |
|
Moderately affected |
56 |
37.3 |
49 |
32.7 |
105 |
35.0 |
|
Significantly/Seriously affected |
17 |
11.3 |
43 |
28.7 |
60 |
20.0 |
|
|
|
|
|
|
|
|
Exam Performance |
|
|
|
|
|
|
|
Unaffected / Slightly affected |
104 |
69.3 |
66 |
44.0 |
170 |
56.7 |
|
Moderately affected |
34 |
22.7 |
41 |
27.3 |
75 |
25.0 |
|
Significantly/Seriously affected |
12 |
8.0 |
43 |
28.7 |
55 |
18.3 |
Table 3: Effect of PMS severity on daily activities
|
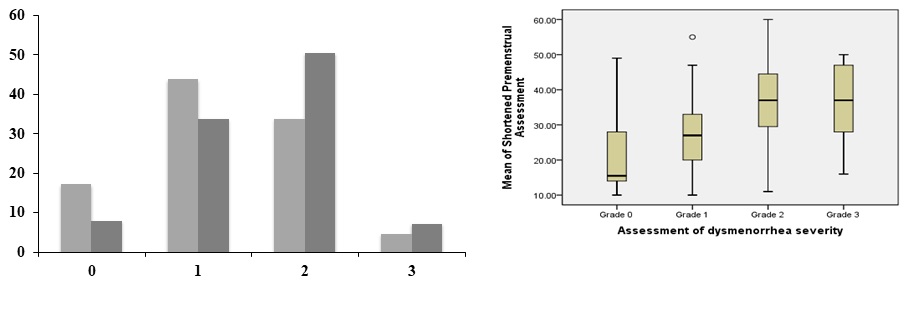
Assessment of dysmenorrhea severity |
School |
Total (n=300) |
Medical(n=150) |
Literature(n=150) |
No |
% |
No |
% |
No |
% |
Grade 0 |
26 |
17.3 |
12 |
8.0 |
38 |
12.7 |
Grade 1 |
66 |
44.0 |
51 |
34.0 |
117 |
39.0 |
Grade 2 |
51 |
34.0 |
76 |
50.7 |
127 |
42.3 |
Grade 3 |
7 |
4.7 |
11 |
7.3 |
18 |
6.0 |
Table 4: Assessment of dysmenorrhea severity of the study participants
Data type |
No. |
Shortened Premenstrual Assessment |
Chi square |
P-value |
|
|
Mild (57) |
Moderate (170) |
Severe (73) |
|
|
No |
% |
No |
% |
No |
% |
School |
|
|
|
|
|
|
|
|
|
|
Medical |
150 |
35 |
23.3 |
91 |
60.7 |
24 |
16.0 |
12.374 |
0.002 |
Literature |
150 |
22 |
14.7 |
79 |
52.7 |
49 |
32.7 |
|
|
|
|
|
|
|
|
|
|
|
|
Marital Status |
|
|
|
|
|
|
|
|
|
|
Single |
293 |
52 |
17.7 |
168 |
57.3 |
73 |
24.9 |
13.111 |
0.001 |
Married |
7 |
5 |
71.4 |
2 |
28.6 |
0 |
0.0 |
|
|
|
|
|
|
|
|
|
|
|
|
BMI |
|
|
|
|
|
|
|
|
|
|
<18.5 |
29 |
5 |
17.2 |
17 |
58.6 |
7 |
24.1 |
2.418 |
0.878 |
18.5-24.9 |
128 |
29 |
22.7 |
68 |
53.1 |
31 |
24.2 |
|
|
|
|
|
|
|
|
|
|
|
|
|
25-<30 |
33 |
6 |
18.2 |
20 |
60.6 |
7 |
21.2 |
|
|
30& Above |
39 |
5 |
12.8 |
23 |
59.0 |
11 |
28.2 |
|
|
|
|
|
|
|
|
|
|
|
|
Age of Menarche |
|
|
|
|
|
|
|
|
|
|
<=11 |
39 |
9 |
23.1 |
21 |
53.8 |
9 |
23.1 |
2.561 |
0.634 |
|
12-13 |
162 |
28 |
17.3 |
98 |
60.5 |
36 |
22.2 |
|
|
14& above |
99 |
20 |
20.2 |
51 |
51.5 |
28 |
28.3 |
|
|
|
|
|
|
|
|
|
|
|
|
Duration of the menstruation |
|
|
|
|
|
|
|
|
<6 days |
70 |
13 |
18.6 |
40 |
57.1 |
17 |
24.3 |
0.013 |
0.994 |
6 days & above |
230 |
44 |
19.1 |
130 |
56.5 |
56 |
24.3 |
|
|
|
|
|
|
|
|
|
|
|
|
Family History |
|
|
|
|
|
|
|
|
|
|
Non |
96 |
26 |
27.1 |
57 |
59.4 |
13 |
13.5 |
11.794 |
0.003 |
|
Yes |
204 |
31 |
15.2 |
113 |
55.4 |
60 |
29.4 |
|
|
Exercise |
|
|
|
|
|
|
|
|
|
|
1-3 hrs/ a week |
66 |
19 |
28.8 |
35 |
53.0 |
12 |
18.2 |
14.493 |
0.035 |
< 1 hr a week |
23 |
7 |
30.4 |
13 |
56.5 |
3 |
13.0 |
|
|
Irregular |
180 |
25 |
13.9 |
101 |
56.1 |
54 |
30.0 |
|
|
Never |
31 |
6 |
19.4 |
21 |
67.7 |
4 |
12.9 |
|
|
|
|
|
|
|
|
|
|
|
|
Food Habit |
|
|
|
|
|
|
|
|
|
|
Regular and balanced diet |
42 |
12 |
28.6 |
26 |
61.9 |
4 |
9.5 |
14.146 |
0.001 |
High carbohydrate and junk foods |
48 |
13 |
27.1 |
26 |
54.2 |
9 |
18.8 |
|
|
High vegetables |
10 |
1 |
10.0 |
8 |
80.0 |
1 |
10.0 |
|
|
Irregular |
200 |
31 |
15.5 |
110 |
55.0 |
59 |
29.5 |
|
|
|
|
|
|
|
|
|
|
|
|
Smoking |
|
|
|
|
|
|
|
|
|
|
Lifelong non-smoker |
281 |
56 |
19.9 |
157 |
55.9 |
68 |
24.2 |
3.018 |
0.395 |
Cessation to smoking |
11 |
0 |
0.0 |
8 |
72.7 |
3 |
27.3 |
|
|
Smoker |
8 |
1 |
12.5 |
5 |
62.5 |
2 |
25.0 |
|
|
|
|
|
|
|
|
|
|
|
|
Caffeine |
|
|
|
|
|
|
|
|
|
|
3 cups or more |
90 |
21 |
23.3 |
45 |
50.0 |
24 |
26.7 |
3.167 |
0.530 |
1-2 cups |
106 |
16 |
15.1 |
65 |
61.3 |
25 |
23.6 |
|
|
None |
104 |
20 |
19.2 |
60 |
57.7 |
24 |
23.1 |
|
|
Table S1: SPAF of socio-demographic data of study participants