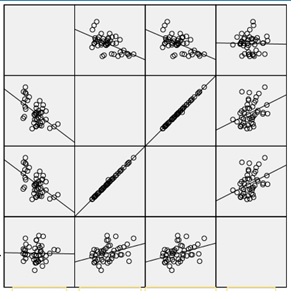
Figure 1 The scatter plot of correlation of leptin changes with body mass index, birth weight, and total weight gain.
Figure 1 The scatter plot of correlation of leptin changes with body mass index, birth weight, and total weight gain.
Factors |
Categories |
Normal group |
Obese group |
p-value |
Education |
Elementary school |
9(40%) |
11(47.8%) |
0.54 |
Diploma or higher |
13(60%) |
12(52.2%) |
||
Income |
Poor economic class |
1(4.5%) |
2(8.7%) |
0.87 |
Middle economic class |
16(72.2%) |
20(87%) |
||
Desirable economic class |
5(21.7%) |
1(4.3%) |
||
Sex of newborns |
Boy |
8(36.4%) |
12(52.2%) |
0.29 |
Girl |
14(63.6%) |
11(47.8%) |
||
Type of deliveries |
Vaginal |
12(54.5%) |
13(56.5%) |
0.89 |
Cesarean |
10(45.5%) |
10(43.5%) |
Table 1: Demographic information of mothers
Parameter |
Categories |
B |
Std. Error |
t |
Sig. |
Intercept |
- |
4.330 |
2.343 |
1.848 |
.073 |
Husband's job |
Services industry |
-0.785 |
0.459 |
-1.711 |
0.096 |
clerk |
- |
- |
- |
- |
|
Number of a family member |
2 |
0.390 |
1.178 |
0.331 |
0.743 |
3 |
-0.010 |
0.703 |
-.014 |
0.989 |
|
≥4 |
- |
- |
- |
- |
|
Infant's gender |
Boy |
-0.615 |
0.343 |
-1.791 |
0.082 |
girl |
- |
- |
- |
- |
|
BMI before pregnancy |
-0.039 |
0.052 |
-0.742 |
0.463 |
|
Number of parturition |
-1.504 |
0.565 |
-2.661 |
0.012 |
|
Number of pregnancy |
1.372 |
0.686 |
2.002 |
0.053 |
|
Number of abortion |
1.524 |
0.362 |
4.208 |
<0.001 |
|
Table 2: General linear model result of factors affecting BMI during pregnancy
Weight(kg)
Leptin (ng/ml) |
Modified total weight gain |
Lambda test |
||||
Pierson test |
||||||
Normal group(22) |
Obese group (23) |
|||||
P value |
R |
P value |
R |
P-Value |
Lambda |
|
Leptin(first trimester) |
P<0/01 |
R= -0/371 |
P<0/01 |
R= -0/148 |
P=0/07 |
-1/8 |
Leptin(second trimester) |
P=0/01 |
R=-0/109 |
P=0/728 |
R=-0/014 |
P=0/47 |
-0/7 |
Leptin changes |
P<0/01 |
R= 0/527 |
P<0/01 |
R=0/254 |
P=0/01 |
2/64 |
Table 3. correlation of leptin levels and total weight gain